8.2 Environmental Legislation, Standards And Criteria
8.3 Project Construction Arrangement and Schedule
8.5 Meteorological Data and Population Data
8.6 QRA For Biogas Facilities.
8.7 QRA For Tai Po Gas Production Plant
8.8 QRA For Liquefied Petroleum Gas (LPG) Storage Facilities
8.10 Environmental Monitoring and Audit Requirements
List of TABLES
Table 8.1 EIA
Study Brief (Appendix E) – Hazard to Life Requirements
Table 8.2
Summary of Ignition Sources assumed in QRA
Table 8.3
Ignition Probabilities of ignition Source
Table 8.4
Overpressure Effects
Table 8.5 Population Data for Concurrent
Projects
Table 8.6 Day
Time Meteorological Data
Table 8.7
Night Time Meteorological Data
Table 8.8
Population for Various Project Development Phases
Table 8.9
Temporary Change in Population
Table 8.10
Operating Conditions of Proposed Biogas Facilities
Table 8.11
Operating Conditions of Existing Biogas Facilities
Table 8.12
Composition and Properties of Biogas from Anaerobic Digestion Process
Table
8.13 Storage Quantities of
Dangerous Goods
Table 8.14
Storage Quantities of Other Chemicals.
Table 8.15
Hazardous Systems Identified at Biogas Facilities within TPSTW
Table 8.16
Failure Frequency Data
Table 8.17
Accident Involvements of Medium / Heavy Goods Vehicles in Hong Kong
Table 8.19
Properties of Naphtha
Table 8.20
Composition of Town Gas [18]
Table 8.21
Physical Properties of Town Gas [18]
Table 8.22
Hazardous Systems Identified at TPGPP..
Table 8.23
Failure Frequency Data for Tank
Table 8.24
Failure Frequency Data for Equipment
Table 8.25
Failure frequency Estimated for Hazardous Sections
Table 8.26
Information of LPG storage tank in Apex Print Limited and Zama Print Limited
Table 8.27 Physical Properties of LPG
Table 8.28 Hazardous Scenarios
List of EXHIBITS
Exhibit 8.1 .......... Biogas Facility and other Fuel Gas DG facilities
covered in QRA
Exhibit 8.2 .......... Hong Kong Societal Risk Criteria
Exhibit 8.3 .......... QRA Methodology
Exhibit 8.4 .......... Event Tree Extracted from MPACT (for Gaseous
Release)
Exhibit 8.5 .......... Event Tree Extracted from MPACT (for Liquid
Release)
Exhibit 8.6 .......... Event Tree Extracted from MPACT (for Catastrophic
Rupture)
Exhibit 8.8 .......... Individual Risk Contours – Construction in Existing
West Plant
Exhibit 8.9 .......... Individual Risk Contours – Operational Phase
Exhibit 8.10 ....... F-N Curve – Biogas Facilities
within the Project Site (Base Case)
Exhibit 8.12 ....... TPGPP and its CZ
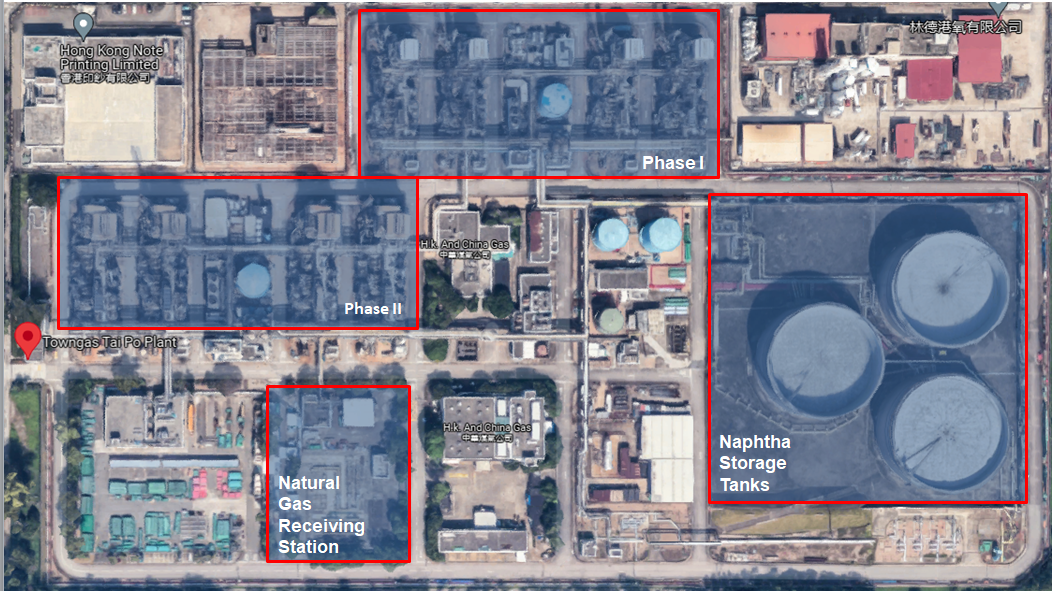
Exhibit 8.13 ....... Layout of TPGPP
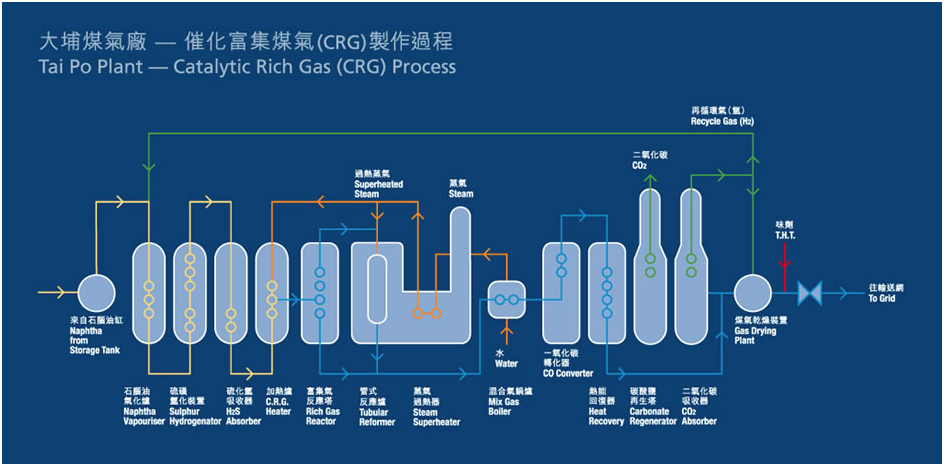
Exhibit 8.14 ....... CRG Process Flow Diagram [18]
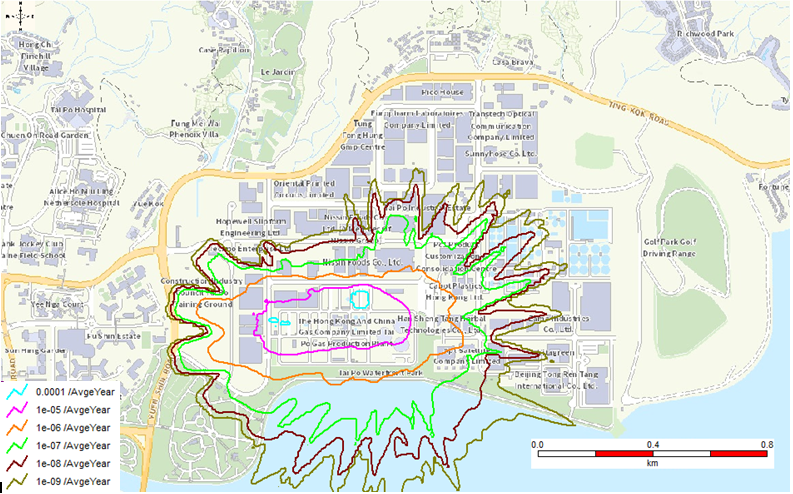
Exhibit 8.15 ....... Individual Risk Contours – Tai Po
Gas Production Plant
Exhibit 8.16 ....... F-N Curve – Tai Po Gas Production
Plant
Exhibit 8.18 ....... Location of LPG Storage and
Vaporizer at Apex Print Limited
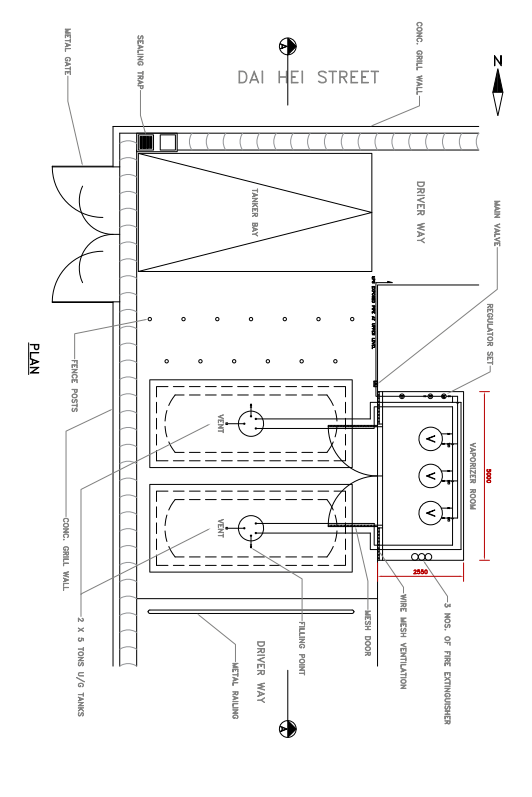
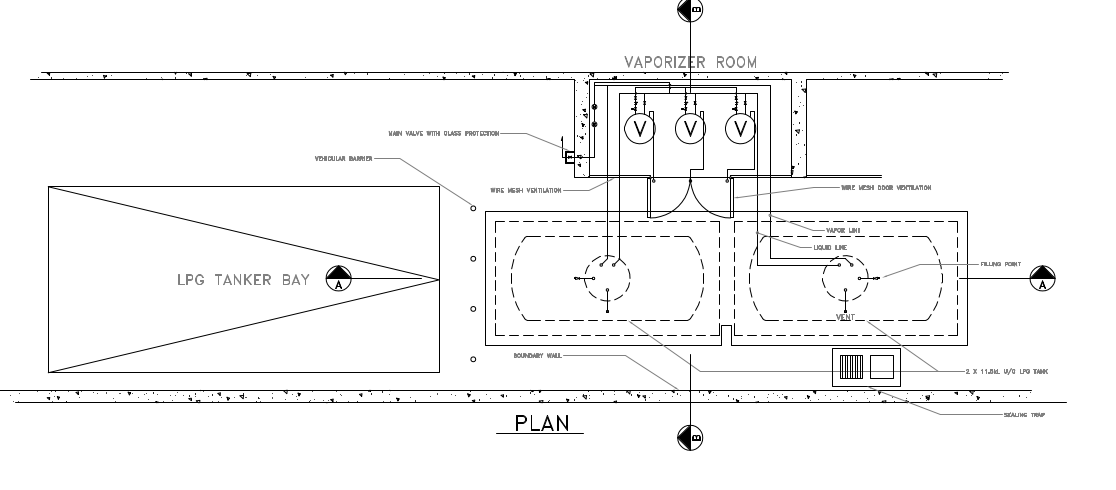
Exhibit 8.19 ....... Plot Plan of LPG Storage and
Vaporizer at Zama Print Limited
Exhibit 8.20 ....... Location of LPG Storage vessel at
Zama Print Limited
Exhibit 8.21 ....... Individual Risk Contours – LPG
Storage Facility at Apex Print Limited..
Exhibit 8.22 ....... Individual Risk Contours – LPG
Storage Facility at Zama Industries Limited
Exhibit 8.23 ....... F-N Curve - LPG Storage Facility
at Apex Print Limited
Exhibit 8.24 ....... F-N Curve - LPG Storage Facility
at Zama Industries Limited
APPENDICES
Appendix 8.1 Population Data
Appendix 8.2 Calculation of Transient Population
Appendix 8.3 Preliminary Layout of Proposed Biogas Facilities and Tentative Locations of Chemical Storage
Appendix 8.4 Existing Biogas Facilities and Tentative Construction Plan
Appendix 8.5 External Hazards Review
Appendix 8.6 PHAST RISK Parameters
Appendix 8.7 Review of Historical Accident
Appendix 8.8 Consequence Data
Appendix 8.9 Failure Frequency for Scenarios Associated with Naphtha Storage Tanks
Appendix 8.10 Projectile Risk Assessment
Appendix 8.11 Detailed FTA
Appendix 8.12 Top Risk Contributors
8
Hazard
to Life
8.1
Introduction
8.1.1 This Project would involve co-digestion of indigenous sewage sludge from Tai Po Sewage Treatment Works (TPSTW), imported sewage sludge from other Sewage Treatment Works (STWs) in East New Territories and imported organic / food waste from the proposed Organic Waste Pre-treatment Centre (New Territories East) (OWPC) co-located adjacent to TPSTW. The sewage sludge and organic / pre-treated food waste will be anaerobically co-digested to generate biogas as an energy source for power supply.
8.1.2 Under Section 5(7)(a) of the Environmental Impact Assessment (EIA) Ordinance (Cap. 499) (EIAO), the Director of Environmental Protection (the Director) has issued a EIA Study Brief No.ESB-321/2019 for this Project (EIA Study Brief), which specifies the technical requirements of Hazard to Life assessments to be conducted for the Project. As stated in Section 2.1 of the EIA Study Brief, the objective of the assessment is to identify any potential hazard to life due to generation, storage, utilization, processing and transmission (if applicable) of biogas within the Project site and due to neighbouring fuel gas dangerous goods (DGs) facilities during the construction and operation of the Project and to propose measures to mitigate these impacts if required. For reference, the detailed requirements as given in Appendix E of the EIA brief are repeated in Table 8.1.
Table 8.1 EIA Study Brief (Appendix E) – Hazard to Life Requirements
|
Biogas 1.
The
Applicant shall investigate methods to avoid and/or minimize risk from biogas
during the construction and operation stages of the Project. The Applicant
shall carry out hazard assessment to evaluate potential hazard to life due to
biogas. 2.
The
hazard assessment shall include the following:
i.
Identify
hazardous scenarios associated with the generation, storage, utilization,
processing and transmission (if applicable) of biogas due to the Project and
hazardous scenarios due to neighbouring dangerous
goods (DGs) facilities which may cause impact to the biogas facilities of the
Project (including but not limited to DGs stores at Linde HKO Limited) and
then determine a set of relevant scenarios to be included in a Quantitative
Risk Assessment (QRA);
ii.
Execute
a QRA of the set of hazardous scenarios determined in sub-section (i) above, expressing population risks in both individual
and societal terms;
iii.
Compare
individual and societal risks with the criteria for evaluating hazard to life
stipulated in Annex 4 of the TM; and
iv.
Identify
and assess practicable and cost-effective risk mitigation measures. 3.
The
methodology to be used in the hazard assessment shall be consistent with
previous studies having similar issues. Fuel
Gas Dangerous Goods including Liquefied Petroleum Gas and Town Gas 4.
The
Applicant shall carry out hazard assessment to evaluate the risk due to fuel
gas dangerous goods (DGs) facilities in the vicinity, including Zama
Industries Limited and Apex Print Limited during construction and operation stages
of the Project. The Applicant shall provide the estimated numbers of
construction workers and staff of the Project during construction and
operation stages of the Project respectively, and seek the Director’s
agreement on whether the hazard assessment has to cover risk due to Tai Po
Gas Production Plant. The hazard assessment shall include the following:
i.
Identify
hazardous scenarios associated with the fuel gas DG facilities with a view to
determining a set of relevant scenarios to be included in a QRA;
ii.
Execute
a QRA of the set of hazardous scenarios determined in sub-section (i) above, expressing population risks in both individual
and societal terms;
iii.
Compare
individual and societal risks with the criteria for evaluating hazard to life
stipulated in Annex 4 of the TM; and
iv.
Identify
and assess practicable and cost-effective risk mitigation measures. 5.
The
methodology to be used in the hazard assessment shall be consistent with
previous studies having similar issues. |
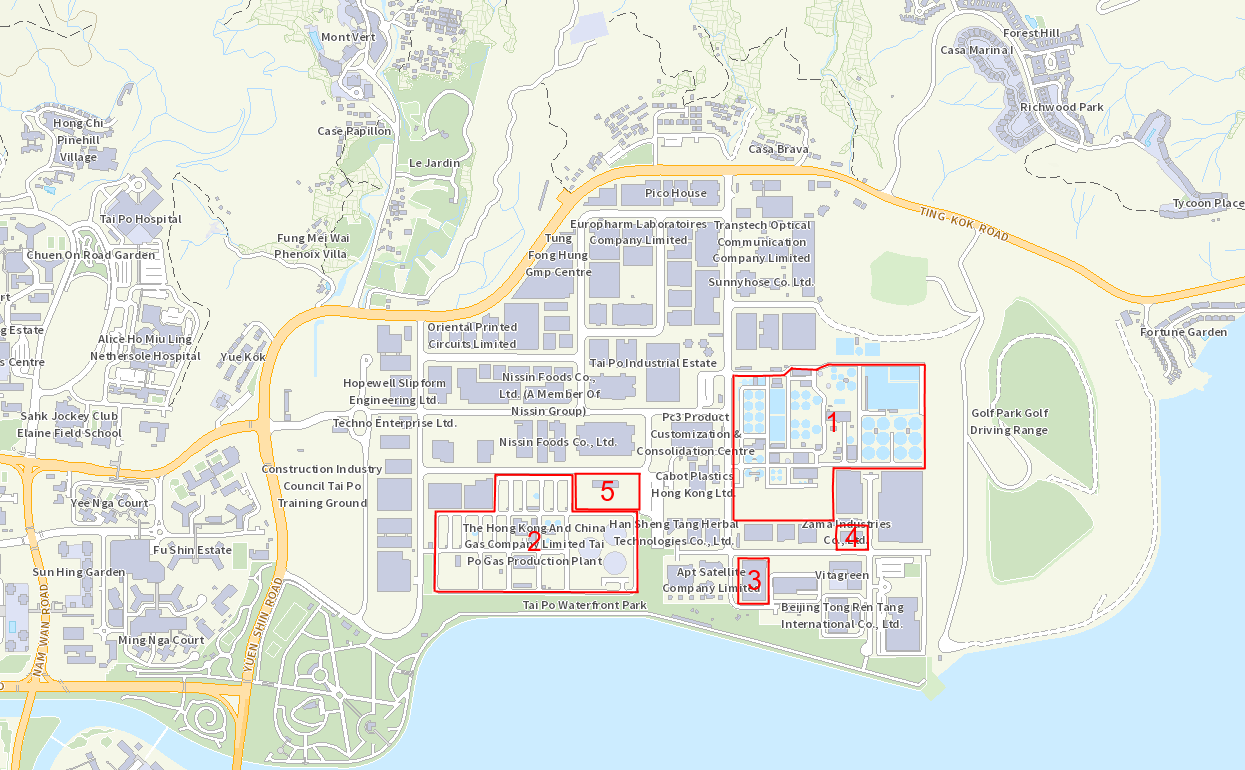
8.1.3 On this basis, a Quantitative Risk Assessment (QRA) has been conducted to evaluate hazardous scenarios associated with the proposed Project and other fuel gas DG facilities in the vicinity of the proposed Project. The facilities covered in the QRA include the followings:
1. Biogas Facilities within the proposed Project Site
2. Tai Po Gas Production Plant (TPGPP)
3. Liquefied Petroleum Gas (LPG) storage facility at Apex Print Limited
4. Liquefied Petroleum Gas (LPG) storage facility at Zama Industries Limited, and
5. Dangerous Goods (DGs) storage at Linde HKO Limited
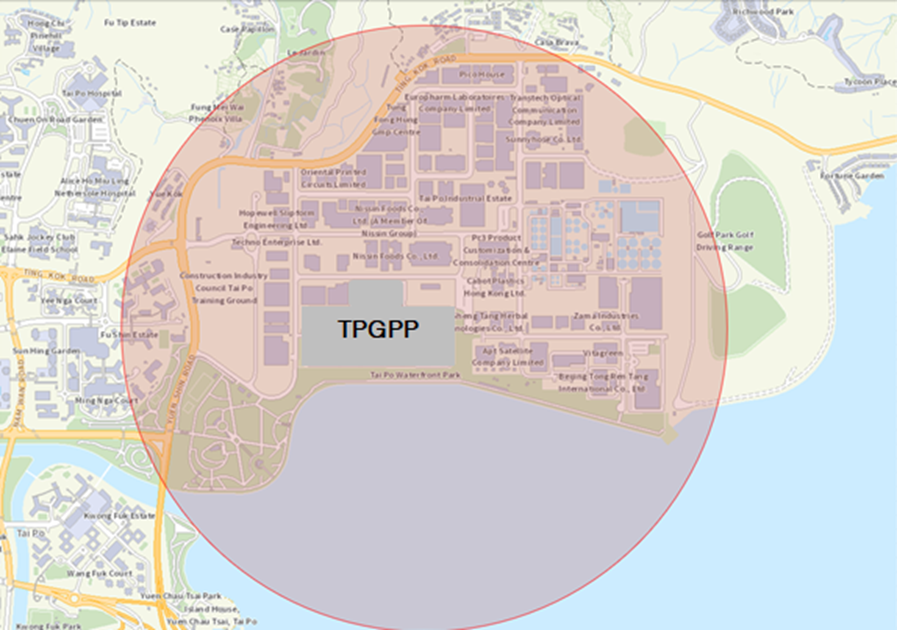
8.1.4 The Project site location in relation to the above facilities is shown in Exhibit 8.1. Notably, TPGPP is a Potentially Hazardous Installation (PHI).
Exhibit
8.1
Biogas Facility and other Fuel Gas DG facilities covered in QRA
8.2
Environmental Legislation,
Standards and Criteria
8.2.1 The assessed risk levels of hazardous sources shall be compared with the risk guidelines stipulated in the EIAO-TM Annex 4 [2] to determine the acceptability. As set out in the EIAO-TM Annex 4, the risk guidelines comprise the following two components:
1. Individual Risk: The maximum level of off-site individual risk should not exceed 1 × 10⁻⁵ / year, i.e. 1 in 100,000 per year; and
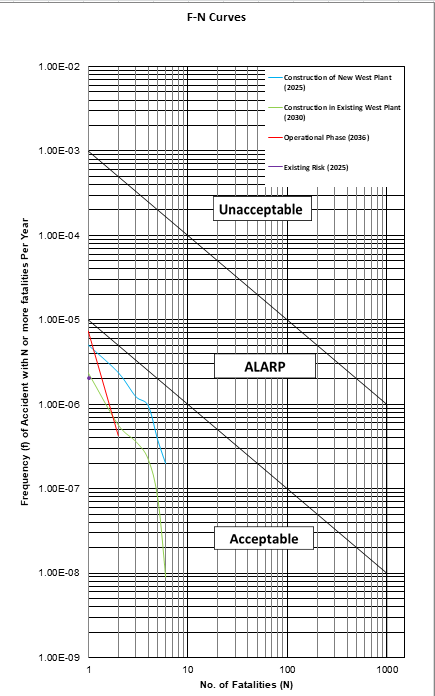
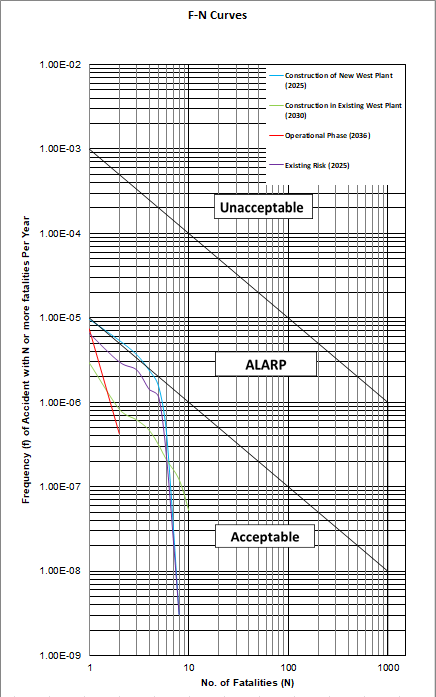
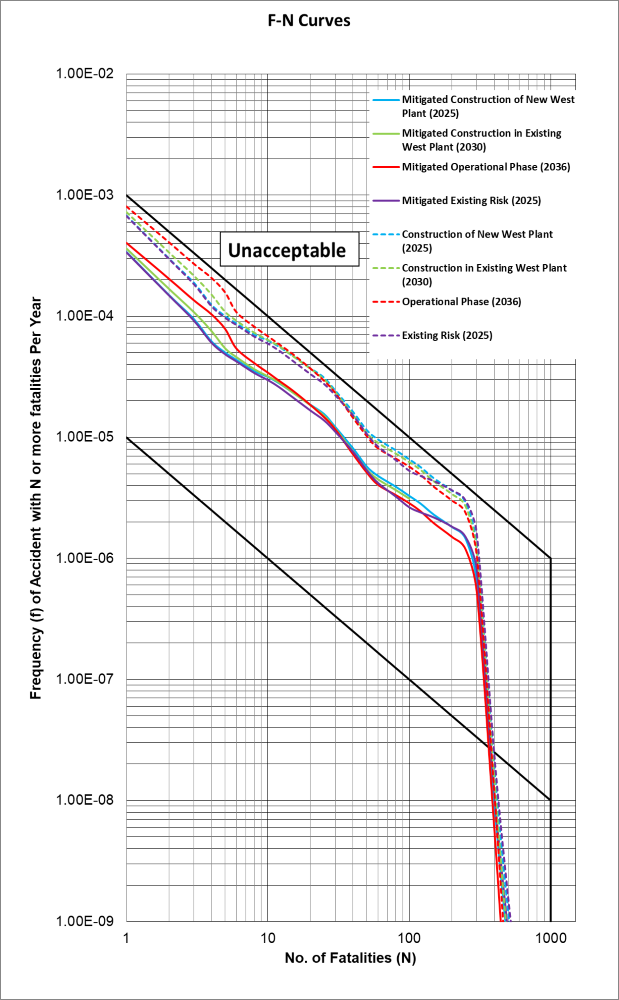
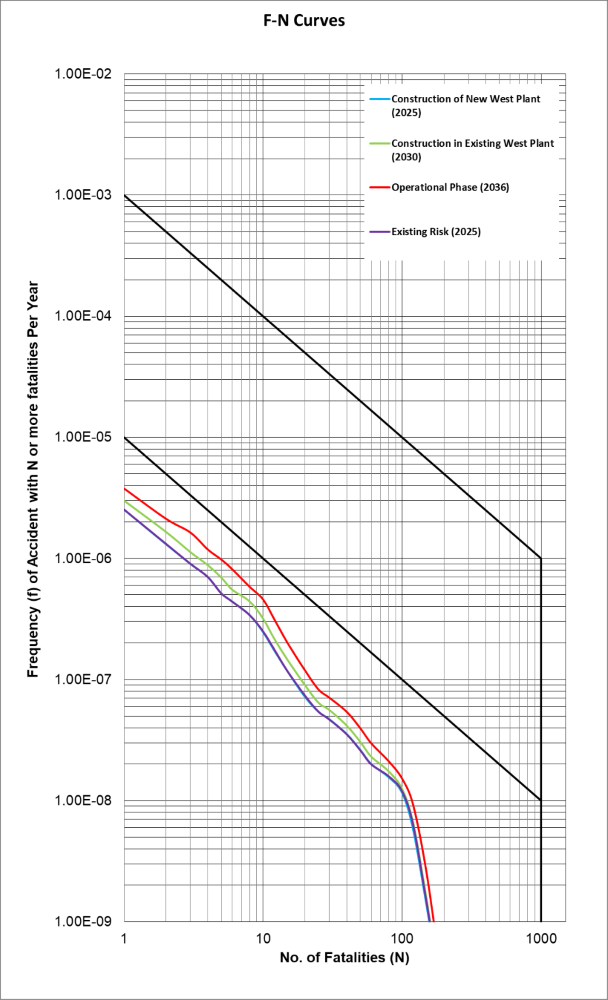
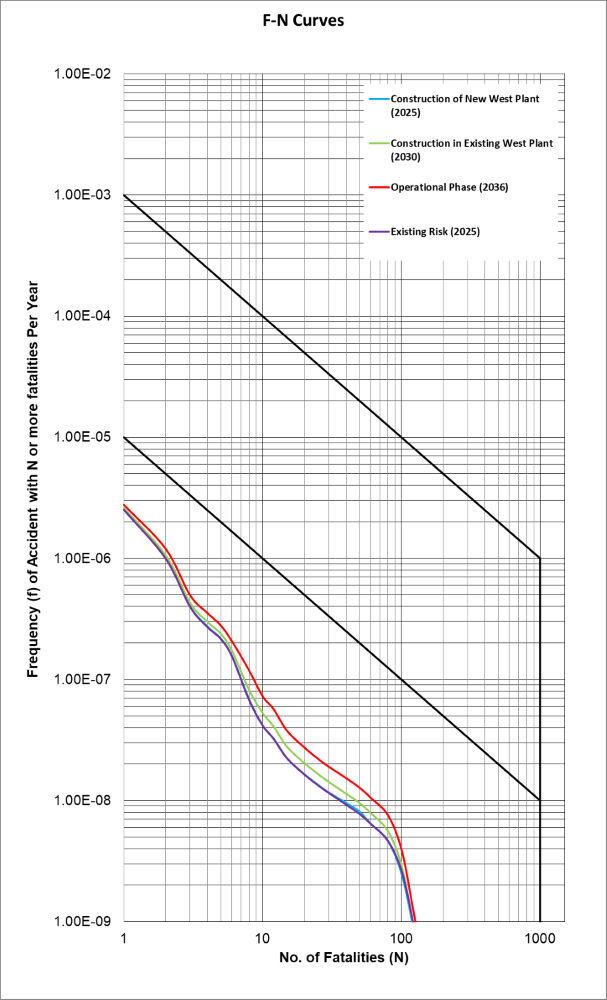
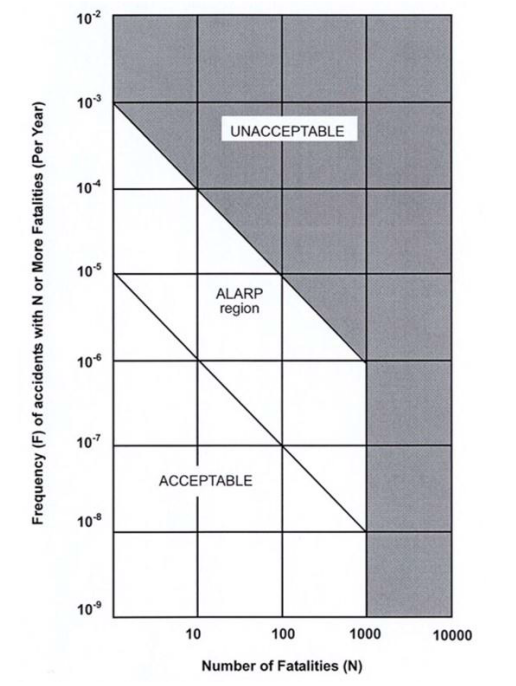
2. Societal Risk: Societal risk is expressed in the form of an F-N curve (Exhibit 8.2), which represents the cumulative frequency (F) of all event outcomes leading to N or more fatalities. The F-N curve consists of three different regions defined as follows:
n Unacceptable region: where risk is so high that they should usually be reduced regardless of the cost or else the hazardous activity should not proceed;
n ALARP region: where risk is tolerable, provided that it has been reduced to a level As Low As Reasonably Practicable (ALARP); and
n Acceptable region: where risk is broadly acceptable and does not require further risk reduction.
Exhibit
8.2
Hong Kong Societal Risk Criteria
8.3 Project Construction Arrangement
and Schedule
8.3.1
The existing TPSTW comprises two independent
plants, namely West Plant and East Plant. In order to maintain normal sewage
treatment services of the existing TPSTW during the construction phase, a New
West Plant would be built in the proposed expansion site. The New West Plant
would be a relatively compact Sewage Treatment Works (STW) and be able to
provide adequate sewage treatment capacity to meet the projected sewage flow
buildup before the normal treatment services of the existing West Plant is
decommissioned. After the New West Plant is fully commissioned, the existing
West Plant would be partially demolished to make room for the construction of
new facilities such as the sludge treatment and co-digestion works.
8.3.2
The construction works
of this Project are tentatively scheduled to commence in 2025 for completion in
2036. Majority of the demolition
works in the existing West Plant of TPSTW would be carried out from 2027 to
2033 after the New West Plant in the proposed expansion site is in operation.
8.4
QRA Methodology
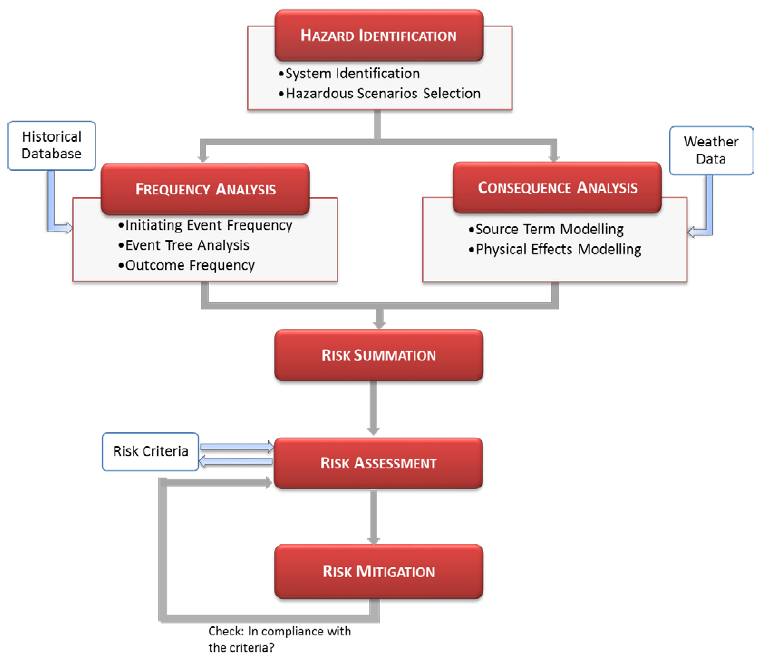
8.4.1 The key elements of a QRA study are outlined in Exhibit 8.3.
Exhibit 8.3 QRA
Methodology
8.4.2 While the following paragraphs of this section describe the general QRA methodology employed, the facility-specific approaches and assumptions are detailed in the respective facility QRA sections of this hazard to life assessment.
8.4.3 In general, the following previously approved QRA studies have been referenced when developing the QRA for this Project:
n SEKD EIA Report [11]
n Yuen Long Biogas [33]
n Chai Wan Government Complex and Vehicle Depot EIA Report [9]
n HATS Stage 2A EIA Report [10]
n LPG Shell Depot [27]
n LPG Storage at Choi Po Court [35]
Hazard Identification
8.4.4 The hazard identification involved a review of the hazardous material properties and a review of the past accidents, with the objective of identifying potential hazards and scenarios to be modelled in the subsequent frequency and consequence analysis. The summary of review of historical accidents is presented in Appendix 8.7. In addition, external hazards review was also carried out to assess potential hazards raised due to external sources such as aircraft crash, earthquake, etc. and the summary is presented in Appendix 8.5.
8.4.5 The following hazardous events are generally considered in the event of a loss of containment scenario:
n Fireball: In the case of immediate ignition of an instantaneous gas release, this will result in a fireball. Typically, a fireball occurs due to catastrophic ruptures of process equipment/vessels. A fireball is of hemispherical shape emitting thermal radiation. Thermal radiation from a fireball is independent of weather and wind direction.
n Pool Fire: A pool fire occurs upon the ignition of flammable liquid which has been spilled on the ground.
n Jet Fire: A jet fire occurs as a consequence of ignition of pressurized gas releases. A jet fire emits thermal radiation and hence can cause harm to population in the vicinity.
n
Flash Fire: A flash fire occurs when a flammable gas release occurs, however
ignition is delayed. If the ignition source is within the Upper Flammability
Limit and Lower Flammability Limit, it shall result in ignition of the
flammable release. If the release does not come in contact with an ignition
source, prior to being diluted below its Lower Flammability Limit, no harm is
anticipated as the gas is too lean for ignition.
n
VCE: When a flammable vapour cloud forms, disperses
and accumulates in areas with high congestion and / or confinement, and is then
ignited, a Vapour Cloud Explosion (VCE) may occur,
leading to damaging overpressures to buildings and resulting in building damage
/ collapse.
n Toxic Release: An unignited release may pose a hazard if the release stream contains significant amount of toxic material.
n Boiling-Liquid
Expanding-Vapor Explosion (BLEVE): An
explosion caused by a liquid which is boiling and continuing to produce a
flammable vapor.
Frequency Analysis
8.4.6
Frequency analysis is used to derive the final
event outcome frequencies. By using historical failure frequency data, the
failure event outcome frequency is determined. The likelihood of each
identified scenario was quantified taking into account the site-specific
features and project activities. In
general, initial hazardous event frequencies, i.e. loss of containment, were
derived from historical databases and then modified, as required, to factor in
the site-specific conditions. Where required, Fault Tree Analysis (FTA) was
also carried out to quantify the various possibilities of event combinations as
well as the typical safety systems in place.
8.4.7 Following a leak or rupture, various hazardous events may arise depending on the release conditions (e.g. instantaneous or continuous release, rainout and vaporization of the released material) as well as the type of ignition (e.g. immediate or delayed ignition). The frequencies of these undesired outcome events such as flash fire, pool fire, jet fire, explosion, etc. were derived using Event Tree Analysis (ETA).
8.4.8
ETA is an analysis technique which identifies
different possible outcomes following an initiating event and estimates the
probabilities for each of these outcomes. Event Tree starts with initiating
event and proceeds by examining each contributing factor in chronological order
to identify all possible outcomes. The frequencies of event outcomes are
calculated by multiplying the initiating event frequency and probabilities of
all contributing factors leading to the specific hazardous event. In this
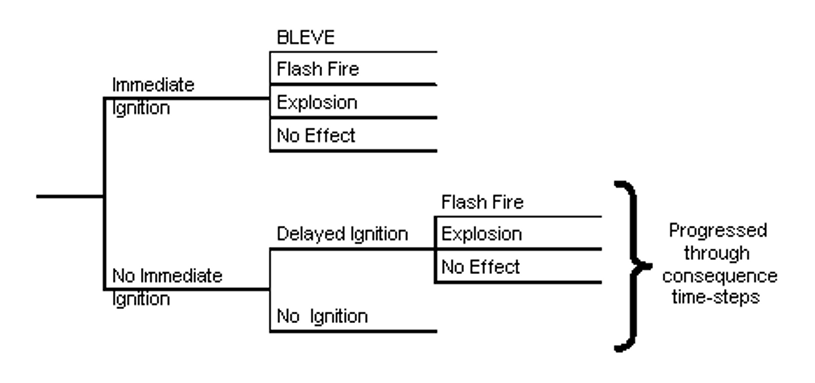
study, PHASTRISK Event Tree was used to generate the outcome events. The detailed parameters used in PHASTRISK are presented in Appendix 8.6. The figures below
present the event trees for various scenarios for MPACT used in the QRA,
including gaseous release, liquid release, and vessel catastrophic rupture.
Exhibit 8.4 Event Tree
Extracted from MPACT (for Gaseous Release)
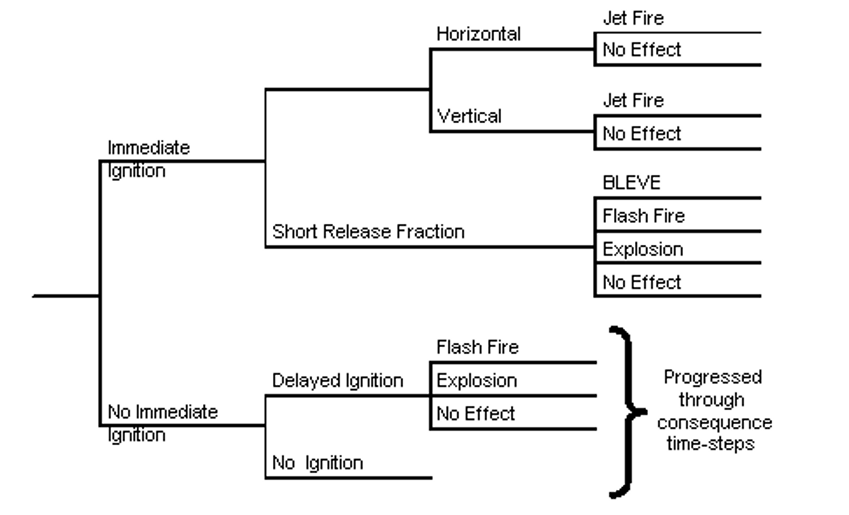
Exhibit 8.5 Event Tree
Extracted from MPACT (for Liquid Release)
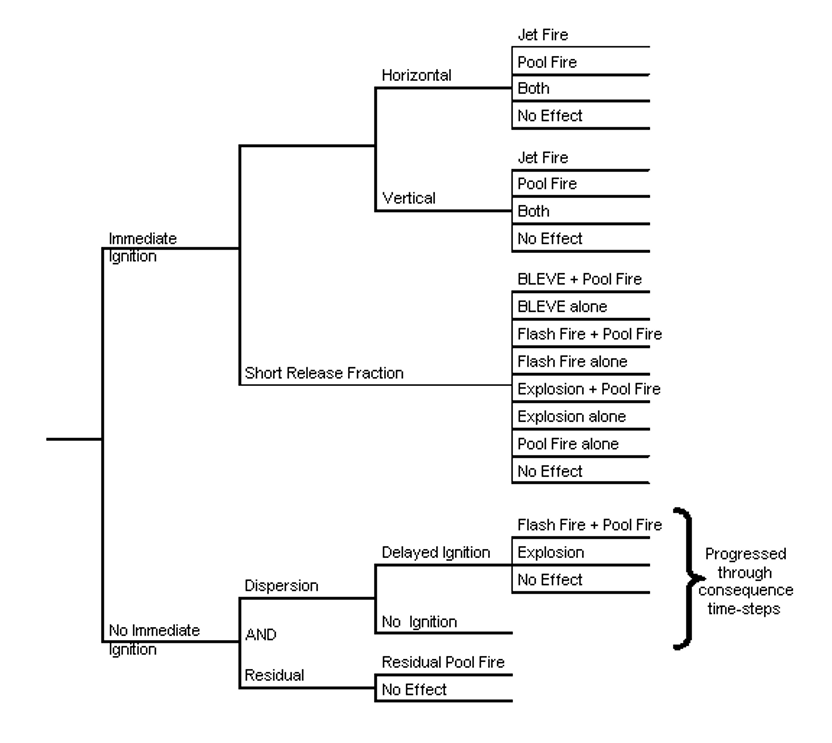
Exhibit 8.6 Event Tree
Extracted from MPACT (for Catastrophic Rupture)
8.4.9
The
immediate ignition probability was determined based on TNO material reactivity
method [6] in PHASTRISK, which takes into account the
size of release and the flammability of released substance. The delayed ignition
probability was estimated based on the specific ignition sources identified in
the area. Based on the guidelines by Purple Book [6], the probability of ignition by an ignition
source is dependent on its ignition efficiency and the presence factor within
the source.
Noted that the ignition efficiency for Industrial Building category is
based on "Heavy Industry" and "Light Industry". For Light
Industry, the efficiency is a function of population size and it is
conservatively capped at 0.4 same as Road Vehicles. The main ignition sources in the area
and the ignition efficiency assumed have been summarized in Table 8.2 and Table 8.3.
Table 8.2 Summary of Ignition Sources assumed in QRA
|
Ignition
Sources |
Description |
Ignition Efficiency* |
|
Flare and furnace |
Open flame or very hot surfaces |
1 |
|
Combined Heat and Power Generation System (CHP) in TPSTW |
Hot surface and combustion |
1 |
|
TPGPP Process Trains |
Heating and rotating equipment |
0.45 |
|
Factories |
Potential hot works and
heavy machine operations |
0.7 |
|
Industrial buildings |
Smoking, cooking and use
of electrical appliances |
0.4 |
|
Road Vehicles |
Vehicle engines and hot
exhaust gases |
0.4 |
|
TPSTW Process Equipment |
High power consumption or high speed pumps and motors |
0.45 |
*ignition efficiency in a period of 60 seconds (derived from Purple Book
based on the ignition source type).
Table 8.3 Ignition
Probabilities of ignition Source
|
Ignition
Sources |
Type |
Ignition Probability in 60s |
Presence Factor |
|
Tai Po Towngas Production Train (PT1 – 8) |
Area |
0.45 |
1 |
|
Tai Po Towngas Furnace Phase 1 |
Line |
1 |
1 |
|
Tai Po Towngas Furnace Phase 2 |
Line |
1 |
1 |
|
South China Morning Post |
Area |
0.4 |
1 |
|
Tao Heung Group |
Area |
0.4 |
1 |
|
Lee Kee Group |
Area |
0.4 |
1 |
|
Hong Kong Note Printing
Ltd. |
Area |
0.4 |
1 |
|
Hong Kong Yamazaki
Baking Co.Ltd. |
Area |
0.4 |
1 |
|
Nissin Foods * |
Area |
0.4 |
1 |
|
Hitachi Chemical |
Area |
0.4 |
1 |
|
Linde HKO Ltd. |
Area |
0.7 |
1 |
|
Golik Metal |
Area |
0.7 |
1 |
|
Yuen Shin Road |
Transportation line |
0.4 |
Refer to hourly vehicle
flow in Appendix 8.2 |
|
Ting Kok
Road |
|||
|
Dai Fuk
Road |
|||
|
Dai Wah Road |
|||
|
Dai Fat Road |
|||
|
Dai Shing Road |
|||
|
Dai Cheong Road |
|||
|
Dai Wang Road |
|||
|
Dai Fu Road |
|||
|
Dai Kwai Road |
|||
|
Dai Hei Road |
|||
|
Dai King Road |
|||
|
Dai Shun Road |
*Refers to Population D in Appendix 8.1.
Consequence Analysis
8.4.10
Consequence
assessment was performed to predict the size, shape and orientation of the
hazard zones resulting from releases of flammable and toxic substances. DNV
PHAST V6.7 was used to perform the consequence modelling, which comprises the
following elements:
n Source term/ discharge modelling
n Dispersion modelling
n Fire and explosion modelling
n Effects modelling
8.4.11
Source
term or discharge modelling involved the determination of maximum discharge
rate, release duration, and other physical properties (such as discharge
velocity and temperature resulting from gas expansion) of the released material
following a leak or rupture. These estimated parameters were then set as the
initial conditions for the subsequent dispersion or fire effects modelling.
8.4.12
In the
event of a release or rupture of piping or equipment, all releases were
modelled as continuous release at the maximum flow rate. For catastrophic
rupture of equipment, the entire volume of the process equipment was taken for
modelling.
8.4.13 Dispersion modelling involved mathematical simulation of how the released materials disperse in the ambient atmosphere. Downwind and crosswind concentrations were determined to find the gas cloud hazard footprint. Vapor dispersion modelling was conducted using PHAST’s Unified Dispersion Model (UDM). The model considers the following aspects of vapor cloud behavior in dispersion modelling:
n Continuous, instantaneous or time-varying releases;
n Jet, heavy-gas and passive dispersion;
n Elevated, touchdown and ground level dispersion;
n Droplet dispersion, rainout and droplet vaporization; and,
n Dispersion over land or water surfaces.
8.4.14 Physical effect modelling determined the magnitude of damage caused by exposure to fire, heat radiation, toxic, or explosion overpressure.
8.4.15
Probit functions were
used to estimate the probability of fatality due to a physical effect, e.g.
thermal radiation, etc. For flammable hazards, such as jet
fire and fireball, the probability of fatality due to the exposure to high
thermal radiation can be calculated with the probit
equation from Purple Book [6] in
the following form:
Where,


8.4.16
For
toxic gas dispersion, probit functions were also used
to relate the probability of human fatality with the gas concentration of the
toxic substance. As an example, the following probit
equation
from Phast can be used to estimate the likelihood of
fatality due to exposure to toxic H2S gas:
Where,

8.4.17
For
overpressure effects, people indoor have a higher harm probability compared to
people outdoor due to the risk of building collapse and flying debris.
Referring to Purple Book [6], the overpressure levels used in the
assessment are presented in Table
8.4.
Table 8.4 Overpressure Effects
|
Explosion Overpressure (bar) |
Fraction of Fatality |
|
|
Indoor |
Outdoor |
|
|
> 0.3 |
1.000 |
1.000 |
|
> 0.1 to 0.3 |
0.025 |
0 |
8.4.18
For flash fire, all persons outdoor within the
flash fire envelope (LFL contour) were assumed to be fatally injured i.e.
fatality rate of 100%.
8.4.19
Buildings are assumed to offer protection to
occupants against fire, and thus indoor protection factor was assumed to be 90%
following previous QRA study [9].
A 100% exposure was assumed for open space.
Risk Summation
8.4.20
Risk summation then combined the estimates of
likelihood and consequence for the identified hazardous events to produce the
risk results, which are expressed in terms of individual risk and societal risk
as per EIAO-TM [2]. Risk mitigation
measures are recommended, where required to reduce the risk to As low As
Reasonable Practicable (ALARP). DNV PHASTRISK v6.7 was used for modelling
and risk summation.
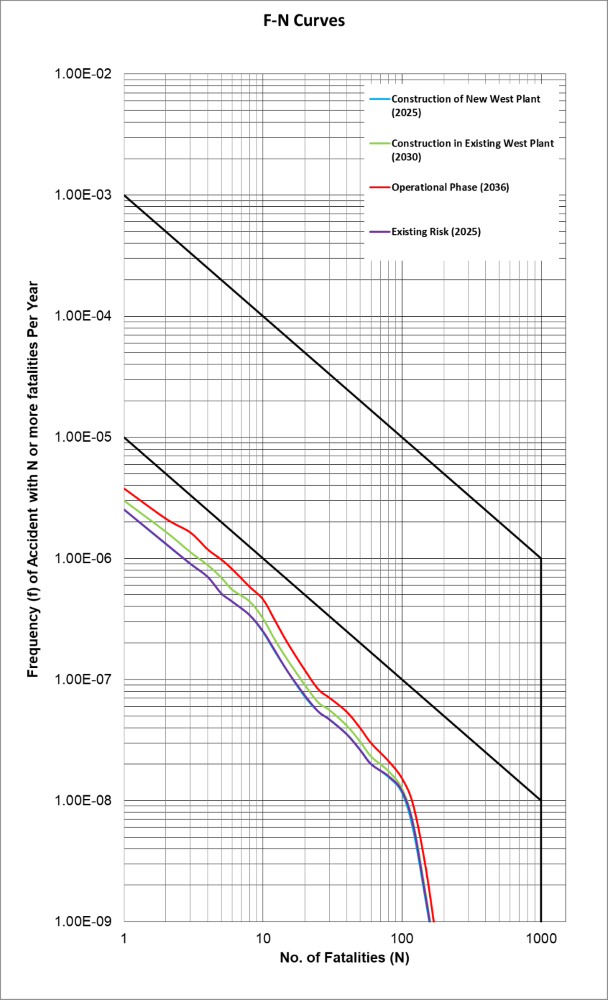
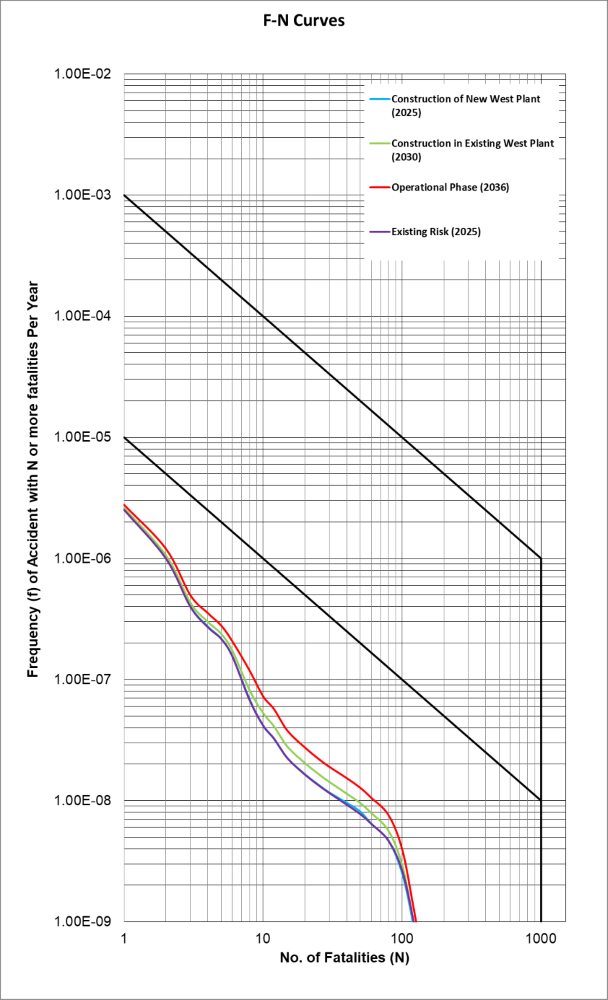
8.4.21
To
study the effects on different facilities onsite and change in construction
workforce in the various phases of the Project, three representative study
cases were considered for societal risk assessment:
n Construction of New West Plant (2025)
n Construction in Existing West Plant (2030), and
n Operational Phase (2036).
Sensitivity Case for Concurrent Project
Construction
8.4.22
In
addition to the proposed Project, it is noted that there are two related
projects which are planned to have construction works within the proposed
Project location, or in adjacent plot. Therefore, a sensitivity analysis of
societal risk considering these concurrent projects is also carried out. The
identified concurrent projects are described below and their locations are
shown in Figure
2.2. Note that the population data for
concurrent project was estimated by the project contractor based on past actual
data for similar projects.
Proposed
Organic Waste Pre-treatment Centre
8.4.23
Development
of Organic Waste Pre-treatment Centre (New Territories East) is an interfacing
project proposed by EPD under “Agreement No. CE 5/2021 (EP)”. The proposed
Organic Waste Pre-treatment Centre (OWPC) is planned to receive and pre-treat
the source-separated food waste for transferring to the Tai Po Sewage Treatment
Works (TPSTW) and / or off-site anaerobic digesters in other Sewage Treatment
Works (STW) for co-digestion with sewage sludge. It is tentatively scheduled to
commence construction in 2025 for completion by 2029.
Proposed THEES Upgrading
8.4.24
This is
a separate interfacing project proposed by EPD under “Agreement No. CE 13/2015
(DS)”. It involves upgrading of the effluent conveyance capacity of Tolo Harbour Effluent Export
Scheme (THEES) in order to cater for the projected effluent flow of this
Project. The proposed THEES upgrading works involve expansion of the Tai Po
Effluent Pumping Station (TPEPS) within the Project site, as well as
construction of a new effluent rising mains in Tai Po Industrial Estate (TPIE)
and a new submarine pipeline (across inner Tolo Harbour) to handle the Project flow. The proposed
TPEPS expansion located within the Project site will be constructed and
operated under this Project and incorporated into the construction programme and design of this Project. Construction of the new effluent rising
mains and submarine pipeline will be undertaken separately and is tentatively
scheduled to commence in 2025 for completion 2031. All the proposed THEES
upgrading works are committed to match the implementation programme
of this Project.
Table 8.5 Population Data for Concurrent Projects
|
Concurrent
Project |
Max.
No. of Worker in TPIE During Construction Phase |
Max.
No. of Worker in TPIE During Operational Phase |
|
OWPC |
300 * |
35 # |
|
THEES Upgrading Works |
100 * |
0 # |
*
Size of construction workforce was
estimated based on experiences in other construction contracts of similar
scale.
# Data was confirmed by the
respective project proponent to be acceptable for use in this assessment.
8.5
Meteorological Data and Population Data
Meteorological Data
8.5.1
The meteorological conditions affect the
consequence of gas release in particular the wind direction, speed and
stability, which influence the direction and degree of turbulence of gas
dispersion. The latest meteorological data (as of January2022) was collected
from Tai Po Kau Weather Station [3] considering the past
6-year data (2015 – 2020). Twelve weather directions were considered, and two
different sets of Meteorological data were used for representing the Day time
and Night time weather condition. Ambient temperature and relative humidity
were taken as 25 oC and 80%, respectively
[53].
8.5.2
Table 8.6 and Table
8.7 present the day time and night time
meteorological data, respectively.
Table 8.6 Day Time Meteorological Data
|
Direction |
Weather Class |
Total |
|||||
|
3B |
1D |
4D |
6D |
1F |
3E |
||
|
0 - 30 |
0.14 |
0.71 |
0.11 |
0.07 |
1.41 |
0.01 |
2.45 |
|
30 - 60 |
0.29 |
0.96 |
0.26 |
0.10 |
0.78 |
0.15 |
2.53 |
|
60 - 90 |
4.72 |
2.53 |
2.37 |
1.08 |
1.30 |
0.51 |
12.5 |
|
90 - 120 |
10.4 |
4.20 |
4.94 |
6.94 |
3.04 |
1.04 |
30.5 |
|
120 - 150 |
2.33 |
2.88 |
3.07 |
1.05 |
3.97 |
0.94 |
14.2 |
|
150 - 180 |
0.88 |
1.62 |
0.52 |
0.00 |
3.59 |
0.11 |
6.71 |
|
180 - 210 |
1.33 |
1.14 |
0.22 |
0.03 |
1.97 |
0.03 |
4.71 |
|
210 - 240 |
1.23 |
0.74 |
0.19 |
0.00 |
0.89 |
0.03 |
3.08 |
|
240 - 270 |
1.07 |
1.40 |
0.97 |
0.08 |
2.42 |
0.77 |
6.71 |
|
270 - 300 |
1.94 |
1.25 |
3.05 |
0.47 |
2.77 |
0.70 |
10.2 |
|
300 - 330 |
1.00 |
0.71 |
0.75 |
0.21 |
1.38 |
0.22 |
4.27 |
|
330 - 360 |
0.44 |
0.53 |
0.31 |
0.03 |
0.66 |
0.08 |
2.05 |
|
All |
25.7 |
18.7 |
16.8 |
10.1 |
24.2 |
4.59 |
100 |
Table 8.7 Night Time Meteorological Data
|
Direction |
Weather Class |
Total |
||||
|
1D |
4D |
6D |
1F |
3E |
||
|
0 - 30 |
0.06 |
0.07 |
0.03 |
4.96 |
0.02 |
5.14 |
|
30 - 60 |
0.03 |
0.17 |
0.02 |
1.30 |
0.26 |
1.78 |
|
60 - 90 |
0.06 |
1.84 |
0.48 |
2.28 |
1.08 |
5.75 |
|
90 - 120 |
0.09 |
3.76 |
3.16 |
5.07 |
1.75 |
13.8 |
|
120 - 150 |
0.21 |
2.38 |
0.53 |
12.78 |
1.92 |
17.8 |
|
150 - 180 |
0.17 |
0.09 |
0.00 |
14.79 |
0.19 |
15.2 |
|
180 - 210 |
0.09 |
0.04 |
0.00 |
9.68 |
0.07 |
9.87 |
|
210 - 240 |
0.08 |
0.09 |
0.00 |
4.86 |
0.09 |
5.12 |
|
240 - 270 |
0.21 |
0.88 |
0.01 |
7.85 |
1.35 |
10.3 |
|
270 - 300 |
0.09 |
2.18 |
0.12 |
6.97 |
1.17 |
10.5 |
|
300 - 330 |
0.02 |
0.46 |
0.08 |
2.35 |
0.19 |
3.11 |
|
330 - 360 |
0.03 |
0.16 |
0.06 |
1.19 |
0.07 |
1.50 |
|
All |
1.13 |
12.13 |
4.49 |
74.09 |
8.16 |
100 |
Population Data
8.5.3 As noted previously, three assessment years, namely 2025, 2030, and 2036, were considered for the societal risk assessment. The latest population data (i.e. 2021) has been collected and derived from various sources, and then projection was made to give the estimate of the population in future years. The population data used in the QRA is summarized in Appendix 8.1.
Proposed
Upgrading of TPSTW
8.5.4 Currently, the TPSTW has 124 personnel on site. The adjoining plot for the proposed expansion is currently used by external parties, and the number of occupiers is approximately 168 based on questionnaire survey conducted in year 2020. The maximum construction work force has been estimated by the project engineers based on past projects of similar scale. Estimates were made based on monthly anticipated work force on site, the maximum number of construction workers (in the outdoor area) has been estimated to be about 300 for the New West Plant between 2025 and 2029, and about 400 for construction in the Existing West Plant Area between 2029 and 2036. During the operational phase of the Project, there will be about 240 workers onsite, which is still less than the existing level with consideration of removing the existing tenants in the proposed expansion site. Existing and future population within the Project site is presented in the table below.
Table 8.8 Population for Various Project Development Phases
|
Phase |
DSD Personnel |
Existing Occupiers |
Project Construction
Workers (in Outdoor Area) |
|
Current Situation / Baseline (Year 2021) |
124 |
168 |
0 |
|
Construction of New West Plant (Year 2025) |
124 |
0 |
300 |
|
Construction in Existing West Plant (Year 2030) |
124 |
0 |
400 |
|
Operational Phase (Year 2036) |
240 |
0 |
0 |
Note: Population of this
Project is excluded in the QRA for biogas facilities but has been considered in
the remaining QRAs of this study.
Building Population
8.5.5
Population surveys were conducted in December 2020
by interviewing owners or security guards in those sites and Tai Po Industrial
Estate is occupied by industrial buildings and factories. In support of the
QRA, a number of industrial sites provided the actual manning data, which was
used directly in the QRA. From the received actual manning data, an average
industrial population density was also derived, based on which the number of
people for other industrial sites was estimated after factoring in the size of
plot and the scale of facility/ industrial building. The estimated average
density is 0.0045 people per square metre floor area
8.5.6
For other population, estimates were based on
information collected from Census 2021, the Planning Department (PlanD), and site survey (dated August 2020). The following
information and assumptions were adopted to estimate the population:
n Average household size of 3.0 for residential population with the study area according to the average of Tertiary Planning Unit (TPU) 7.2.6, 7.2.2 and 7.2.7 of 2021 Population Census [4];
n Based
on Projections of Population Distribution 2021-2029 [5], the average annual
growth for residential population in TPU 7.2.6 is found to be negative growth.
To be conservative, residential population was assumed to be constant. It may
be noted that the 1km CZ
of TPGPP covers primarily TPU 7.2.7 and, to a lesser extent, also covers some
parts of TPU 7.2.2 and 7.2.6. TPU 7.2.7 is fully developed industrial area and
any increase in population is strictly controlled by CCPHI CZ; therefore,
significant increase in population is not expected. Focusing on the surrounding
area of the proposed Project, TPU 7.2.6 is mainly high rise public housing area
(residential area) while TPU 7.2.2 is mainly vacant plots with low rise
buildings up to a few stories. It may be further noted that the published data
is provided only for combined TPU 7.2.2 and 7.2.7, of which TPU 7.2.7
represents the Tai Po industrial Estate which is the main area of concern, and
TPU 7.2.2 represents a greater area to the north of Ting Kok
Road covering several residential areas and vacant plots for future
development. A;
n Number of students and teachers in kindergartens and schools obtained from the School Profiles; and
n Observations from site survey dated August 2020 with conservative judgement.
8.5.7 In general, it is observed that most buildings in Tai Po Industrial Estate are low to medium rises. The cloud dispersion height results from consequence analysis were used to determine exposed population inside building for each study. Further detail on this protection factor will be discussed in each assessment as applicable.
Road Population
8.5.8
Annual
Average Daily Traffic (AADT) for road traffic data was acquired from the latest
Annual Traffic Census (ATC 2020) [8]. For some roads with no information on the
ATC, the road traffic data was estimated based on-site survey.
8.5.9 A vehicle speed of 50 km/hr has been considered in the assessment. Although for main roads such as Ting Kok and Yuen Shin Road, vehicles can reach up to 70 km/hr, a lower vehicle speed of 50 km/hr was conservatively assumed for estimating the population to account for possible congestions and traffic jams.
8.5.10 Road population can be estimated using the following equation:
Road population = No of vehicles per hr * No. of persons per vehicle * Length of Road within
Study Zone / Speed
8.5.11 The road population data from the ATC has been further projected to the studied case year using the calculated average road population growth rate which was found to be 2.6% per year. The detailed calculation and tabulation of projected road population data, including the population between day and night is provided in Appendix 8.2.
Time
Period and Occupancy
8.5.12 In order
to reflect the transient change of population, 4 time periods, namely weekday
day, weekday night, weekend day, and weekend night were considered.
Accordingly, the percentage of occupancy assumed for each population category
is presented in Table
8.9. It may
be noted that the occupancy and outdoor distribution assumed are consistent
with previous QRAs [8][9][10][11][12].
Table 8.9 Temporary
Change in Population
|
Category |
Time
period |
|||
|
Weekday
Day (Mon-Fri
0700-1900 hrs) |
Weekday Night
(Mon-Fri 1900-0700 hrs) |
Weekend
Day (Sat-Sun 0700-1900 hrs) |
Weekend
Night (Sat-Sun 1900-0700 hrs) |
|
|
Commercial |
100% |
10% |
40% |
5% |
|
Industrial |
100% |
10% |
40% |
5% |
|
Residential |
25% |
100% |
70% |
100% |
|
Recreational |
50% |
5% |
100% |
5% |
|
Car Park |
100% |
10% |
50% |
10% |
|
School |
100% |
1% |
100% |
1% |
|
Construction |
100% |
1% |
100% |
1% |
|
Road* |
69% |
31% |
69% |
31% |
Note:
*Day night distribution calculation for road population is provided in Appendix
8.2.
8.5.13 An indoor ratio of 95% was applied to the population in residential, commercial buildings and in schools in line with the typical assumption in Hong Kong [9]. Passengers in vehicles were considered to be 100% outdoors, although vehicles may provide certain protection. Population in car park, the open leisure spaces, and the construction sites were considered to be 100% outdoors.
8.6
QRA for Biogas Facilities
Proposed Biogas Facilities
8.6.1 Biogas is utilized for providing the heat needed to maintain digester operating temperature and for providing heat to the paddle dryers. In the event of an emergency or equipment outage, digester gas may be flared. The purpose of gas storage is to provide greater flexibility to manage the digester gas pressure. The type of storage assumed operates within the operating pressure of the digesters and does not rely on any kind of pressure boosting or compression. Gas storage is configured as a branch off of the main gas pipeline and can be isolated if maintenance is required.
8.6.2 Gas treatment is required for removing hydrogen sulfide and siloxane from the biogas prior to combustion. Gas pressure is boosted to send first through dehumidification and then siloxane removal. The pressure boosting is required to push the gas through dehumidification and siloxane removal as well as to meet the downstream system operating requirements.
8.6.3 The facility is designed to handle the total biogas production rate of 82,000 m3/ day. Biogas will be processed through the following equipment sequentially:
· Digester
· Hydrogen Sulfide Treatment Media
· Pressure Boosting (blowers)
· Dehumidification
· Siloxane Removal
8.6.4 The table below summarizes the key operating parameters of the biogas storage and treatment facilities, based on process design information available:
Table 8.10 Operating
Conditions of Proposed Biogas Facilities
|
Equipment |
No.
of item (No.
of working + No. of standby) |
Volume |
Pressure |
Temperature |
|
Digester |
3 batteries (4
in each battery); overall 9+3 |
8958 |
32 mbarg |
35 degC |
|
Gas holders |
4 (3+1) |
3207 |
32 mbarg |
35 degC |
|
Hydrogen Sulfide
Treatment Media |
5 (4+1) |
48.3 |
32 mbarg |
35 degC |
|
Pressure
Boosting (blowers) |
3 |
- |
32 mbarg |
35 degC |
|
Dehumidification |
2 trains (1+1) |
75 |
32 mbarg |
35 degC |
|
Siloxane Removal |
3 trains (2+1) |
75 |
32 mbarg |
35 degC |
8.6.5 The preliminary layout of the biogas related facilities of the Project is shown in Appendix 8.3.
Existing Biogas Facilities of TPSTW
8.6.6 There are two existing Biogas facilities on the east and west side of the existing TPSTW. The table below summarizes the key operating parameters of the existing biogas storage and treatment facilities.
Table 8.11 Operating
Conditions of Existing Biogas Facilities
|
Equipment |
No.
of item |
Volume |
Pressure |
Temperature |
|
West Plant Digester |
2 |
1,829 m3 |
32 mbarg |
35 degC |
|
West Plant Gas holders |
1 |
850m3 |
32 mbarg |
35 degC |
|
East Plant Digester |
3 |
2,771 m3 |
32 mbarg |
35 degC |
|
East Plant Gas holders |
2 |
850m3 |
32 mbarg |
35 degC |
8.6.7 Note that under the Project, the existing biogas system in the West Plant will be decommissioned in 2030 and the space will be used to construct new facilities.
8.6.8 The existing biogas related facilities of TPSTW are shown in Appendix 8.4. The tentative construction plans, which illustrate the anticipated schedule for demolishing existing facilities and commissioning new facilities at different construction stages are also included in Appendix 8.4.
Hazard
Identification
Biogas
8.6.9 Biogas is a colourless flammable a combustible mixture of gases at atmospheric conditions that comprises mainly methane (CH4) and CO2. Generally, biogas from anaerobic digestion process has a methane content of 55% to 70% by volume. The exact composition of biogas depends on the substance that is being decomposed. If the material consists of mainly carbohydrates, such as glucose and other simple sugars and high-molecular compounds (polymers) such as cellulose and hemicellulose, the methane production is low. However, if the fat content is high, the methane production is likely to be high. In general, the physical properties of biogas are also similar to those of natural gas, except up to 2,000 ppm of H2S is anticipated and thus the biogas can also exhibit some degree of toxicity.
8.6.10 A loss of containment can lead to jet fire since the system is operated slightly above atmospheric pressure. The released gas, if not ignited immediately, could form a flammable gas plume. The properties of biogas from Anaerobic Digestion (AD) process are summarized in Table 8.12, based on a previous QRA study for Biogas facilities.
Table 8.12 Composition and Properties of Biogas from Anaerobic Digestion
Process
|
Property |
Biogas from
Anaerobic Digestion |
|
Methane Content |
55% - 70% |
|
Carbon Dioxide Content |
30% - 45% |
|
Density |
1.2 Kg/Nm3 |
|
Lower Caloric Value |
23 MJ/Nm3 |
|
Flammability# |
Extremely Flammable |
|
Auto-Ignition
Temperature# |
580°C |
|
Flash Points# |
-188°C |
|
Melting Point# |
-182.5°C |
|
Boiling Point# |
-161.4°C |
|
Flammable Limits# |
5% (Lower) – 15% (Upper) |
|
Vapour Density# |
0.59 – 0.72 (air = 1) |
Remark: # Physical properties of biogas that are similar to natural gas
8.6.11
Given
that the flammability increases with increase of methane content, and the exact
composition of biogas varies with the substance that is
being decomposed, biogas was conservatively modelled as pure methane gas with
2,000 ppm of H2S in consequence analysis. It is highlighted that
biogas storage area is a fully open area with no major congestion, and thus the
risk of vapour cloud explosion (VCE) is considered to
be low(note that congestion and confinement are key conditions for VCE
formation). Therefore, all delayed ignition events were modelled as flash fire
in QRA.
Other Chemicals Stored Onsite
8.6.12
The
storage quantities of all chemicals stored or handled onsite within TPSTW are
listed in Table 8.13 and Table 8.14 with
storage location in Appendix 8.3.
These chemicals are not anticipated to present any major hazard which could
potentially impact offsite area.
Table
8.13 Storage Quantities of Dangerous Goods
|
Substance |
Class |
Usage |
Estimated Storage Quantity |
|
Thinners |
Class 9 |
Plant operation |
2,000L |
|
Hydrochloric acid (HCl) @38% commercial
concentration |
Class 8 |
Cleaning of primary filter |
10,500L (10.5 m3) |
|
Backwashing of ultrafiltration of
reclaimed water |
5,600L (5.6 m3) |
||
|
Sodium Hypochlorite (NaOCl)
@10% commercial concentration |
Class 2 |
Cleaning of primary filter |
10,500L (10.5m3) |
|
Pre-chlorination of reclaimed water |
28,000L (28 m3) |
||
|
Cleaning of ultrafiltration of reclaimed
water |
22,400L (22.4 m3) |
||
|
Residual chlorine dosage |
1,400L (14 m3) |
||
|
Sodium hydroxide (NaOH) @50% commercial
concentration |
Class 8 |
Cleaning of ultrafiltration of reclaimed
water |
4,200L (4.2 m3) |
Table
8.14 Storage Quantities of Other
Chemicals
|
Substance |
Usage |
Estimated Storage Quantity |
|
Sodium Bisulphite
(NaHSO3) @10% diluted concentration |
Pre-chlorination of reclaimed water |
2.7m3 |
|
Carbon
dosing (sugar) |
Denitrification |
16 tons |
|
Ferric
chloride (FeCl3), diluted |
Coagulation / anaerobic digester
sulphide suppression |
526 m3 |
|
Polymer |
Flocculation / centrifuge thickening and
pre-dewatering, or for hydraulic filter press |
58 tons |
|
Anti-scalant |
Prevention of scaling and fouling at
water reuse facility |
2.7m3 |
Hazardous Scenarios
Digester
Failure
8.6.13
Failure
of the digesters could be caused by undetected corrosion, fatigue material or
construction defect. Release of biogas could be from various parts of the
digesters as well as the associated piping and devices. Possible hazardous
outcomes include fireball, jet fire, flash fire and toxic release.
Gas
Holder Failure
8.6.14
Dry
seal (Wiggins) type biogas holders will be used for the proposed facility. A
dry seal (Wiggins) type gas holder is different from column guided water-sealed
gas holder that do not have a gas holder crown. A seal is installed between the
piston and the inside of the shell to maintain gas tightness inside the holder
and prevent rotation or side movement of the piston. A levelling system
consists of wire ropes and balance weights are equipped to prevent tilting of
the piston. The seal and the levelling system will be inspected regularly.
8.6.15
Failure
of the gas holders could be caused by undetected corrosion, fatigue, material
or construction defect. Release of biogas could be from various parts of the
gas holders or associated piping and devices. Possible hazardous outcomes
include fireball, jet fire, flash fire and toxic release.
Sulphur
Absorption Vessel Failure
8.6.16
The
absorbents used for removal of H2S in the sulphur
absorption vessels are neither flammable nor explosive that the major hazard
will be from the release of biogas. Failure of sulphur
absorption vessels could be caused by undetected corrosion, fatigue, material
or construction defect. Release of biogas could be from various parts of the process
vessels as well as associated piping and devices. Possible hazardous outcomes
include fireball, jet fire, flash fire and toxic release.
Aboveground
Inlet or Outlet Piping Failure
8.6.17
Piping
will be used to connect process vessels to the gas holder, compressor, and
further purification unit and Combined Heat and Power Generation System (CHP).
Failure along the on-site piping may be caused by undetected corrosion,
fatigue, material or construction defect, or associated with flange gasket /
valve leakage resulting in continuous gas release to the atmosphere. Failures
of gaskets and valve leak only tend to give relatively small scale leakage and
will not contribute to any off-site risk. Nonetheless, gasket and valve leak
failure were considered and included into pipework failure in this hazard
assessment with reference to previous similar study. Possible hazardous
outcomes from aboveground piping jet fire, flash fire and toxic release.
Construction
Activities
8.6.18
During
the construction phase of the Project, all major construction activities should
be arranged with either adequate setback or physical barrier from the existing
gas installations. Implementation of those major construction works and
movement of plants and vehicles would be controlled to have suitable setback
clearance, or physical barrier with an empty digester / gas holder from the
digesters / gas holders in operation. As such, no additional potential biogas
hazard during the construction phase was considered in the QRA.
Vehicle
Impact
8.6.19
Only
authorized vehicles will be permitted to enter the proposed TPSTW with
restriction of speed for vehicle movements in the site. Safety markings and
marked crash barriers will be provided to the above ground piping, digesters
and gas holders near the access road. Vehicle impact could cause leakage and
rupture to digesters and gas holders [39].
8.6.20
The
hazardous events considered are summarized in Table
8.15.
Table 8.15 Hazardous Systems Identified at Biogas Facilities within TPSTW
|
Hazardous Systems in TPSTW |
Main Equipment |
Hazardous Material* |
Hazard Events |
|
Digester |
Vessel and Piping |
Biogas with H2S |
Fire ball, Jet fire, Flash fire, Toxic |
|
Biogas Holder |
Vessel and Piping |
Biogas with H2S |
Fire ball, Jet fire, Flash fire |
|
H2S Removal |
Vessel and Piping |
Biogas |
Fire Ball, Jet fire, Flash fire, |
|
Booster |
Compressor |
Biogas |
Fire Ball, Flash fire, Jet fire |
|
Dehumidifier |
Vessel, Heat Exchanger, and Piping |
Biogas |
Fire Ball, Flash fire, Jet fire |
|
Siloxane Removal |
Vessel and Piping |
Biogas |
Fire Ball, Flash fire, Jet fire |
8.6.21 For each of the hazardous system, a range of leak sizes have been modelled to represent the potential failure scenarios following previous QRA study [33]:
n Process Equipment, Biogas Holders and Piping
· 25 mm hole
· Full bore rupture of piping
· Catastrophic failure of pressure vessel
Frequency
Analysis
Failure Data
8.6.22 With reference to the similar QRA study [33], the base equipment failure frequencies applicable for the biogas facilities are summarized in Table 8.16.
Table 8.16 Failure Frequency Data
|
Component |
Unit |
Hole Size (mm) |
Reference |
|
|
25mm |
Rupture |
|||
|
Vessel |
Per vessel per year |
1.00E-04 |
1.00E-05 |
RIVM [7] |
|
Compressor |
per compressor per year |
5.00E-05 |
1.00E-05 |
RIVM [7] |
|
Piping (per meter) |
per m-year |
5.00E-07 |
1.00E-07 |
RIVM [7] |
Vehicle
Impact
8.6.23
In
addition to the base failure rate, the accident rate due to vehicle impact was
estimated based on statistical data for Vehicle/ Object Crash accident
involving medium and heavy goods vehicles in recent years. The overall numbers
of accidents involvements of Medium / Heavy Goods Vehicles (M/HGVs) [47] in Hong Kong are shown in Table 8.17. From 2006 to 2020, the overall high and
medium impact accident involvement rate per million vehicle kilometer is 0.16,
and therefore the vehicle crash frequency can be estimated as 1.6 x 10⁻⁷ per
vehicle kilometer per year. This frequency has been carried forward to derive
the failure frequency in biogas facilities, as detailed in the fault tree
analysis in Appendix
8.11.
Table 8.17 Accident Involvements of Medium / Heavy Goods Vehicles in Hong
Kong
|
Serious
and Fatal Vehicle Involvements of M/HGVs |
2006 |
2007 |
2008 |
2009 |
2010 |
2011 |
2012 |
2013 |
2014 |
2015 |
2016 |
2017 |
2018 |
2019 |
2020 |
Average |
|
Involvement
rate: per million vehicle-km |
0.86 |
0.82 |
0.8 |
0.76 |
0.83 |
0.91 |
0.89 |
0.87 |
0.93 |
0.86 |
0.96 |
0.94 |
0.90 |
0.95 |
0.91 |
0.88 |
|
Total
Involvements |
1155 |
1081 |
1045 |
907 |
1031 |
1141 |
1105 |
1085 |
1125 |
1063 |
1167 |
1162 |
1083 |
1093 |
1008 |
1083 |
|
Fatal
Involvements |
25 |
21 |
17 |
27 |
16 |
21 |
17 |
25 |
23 |
23 |
18 |
26 |
19 |
22 |
17 |
21 |
|
Serious
Injury Involvements |
212 |
188 |
176 |
147 |
163 |
196 |
175 |
193 |
170 |
250 |
171 |
146 |
134 |
137 |
120 |
171.87 |
|
Fatal
Vehicle Involvements ratio |
2.2% |
1.9% |
1.6% |
3.0% |
1.6% |
1.8% |
1.5% |
2.3% |
2.0% |
2.2% |
1.5% |
2.2% |
1.8% |
2.0% |
1.7% |
2.0% |
|
Serious
Injury Involvements ratio |
18.4% |
17.4% |
16.8% |
16.2% |
15.8% |
17.2% |
15.8% |
17.8% |
15.1% |
23.5% |
14.7% |
12.6% |
12.4% |
12.5% |
11.9% |
15.9% |
|
High
Impact Accident Involvement rate per million vehicle km |
0.02 |
0.02 |
0.01 |
0.02 |
0.01 |
0.02 |
0.01 |
0.02 |
0.02 |
0.02 |
0.01 |
0.02 |
0.02 |
0.02 |
0.02 |
0.02 |
|
Medium
Impact Accident Involvement Rate per million vehicle km |
0.16 |
0.14 |
0.13 |
0.12 |
0.13 |
0.16 |
0.14 |
0.15 |
0.14 |
0.20 |
0.14 |
0.12 |
0.11 |
0.12 |
0.11 |
0.14 |
Projectile Risk from Linde HKO Site
8.6.24
There
are significant numbers of cylinders stored in Linde HKO site and cylinder
projectiles have potential to damage biogas holder leading to catastrophic
failure. Noted that biogas holder in West Plant and new biogas holder are
within 300m – 468m range from the Linde HKO site. Biogas holder in East Plant
is outside the projectile impact range. The frequency calculation is included
in Appendix
8.10. The probability of projectile hitting each
biogas holder is found to be 9.5E-08/year, which is based on 3000 cylinders
assumed in the Linde HKO Site. Although other facilities (i.e. LPG storage in Apex
Print Limited and Zama Print Limited) may have a projectile risk, due to the
limited numbers of vessels as compared to 3000 cylinders in HKO, the projectile
impact is expected to be insignificant (i.e. below 1E-09/year). Therefore
projectile impact only considered risk from Linde HKO Site.
8.6.25 The
summary of event
frequencies used for biogas facility assessment along with the study case year
is presented in Table
8.18.
Table 8.18 Event Frequencies
|
Biogas
Concerned Facility (Applicable
Year) |
Equipment |
Scenario |
Failure
Rate
(per year) |
|
Existing - West (Applicable for 2025) |
Digester |
25mm leakage |
2.68E-04 |
|
Full bore rupture of piping |
1.37E-05 |
||
|
Catastrophic failure of pressure vessel |
2.00E-05 |
||
|
Biogas Holder |
25mm leakage |
2.52E-04 |
|
|
Full bore rupture of piping |
3.04E-05 |
||
|
Catastrophic failure of pressure vessel |
1.01E-05 |
||
|
Existing - East (Applicable for 2025, 2030, and
2036) |
Digester |
25mm leakage |
3.81E-04 |
|
Full bore rupture of piping |
1.62E-05 |
||
|
Catastrophic failure of pressure vessel |
3.00E-05 |
||
|
Biogas Holder |
25mm leakage |
2.91E-04 |
|
|
Full bore rupture of piping |
1.83E-05 |
||
|
Catastrophic failure of pressure vessel |
2.00E-05 |
||
|
New - West (Applicable for 2036) |
Digester |
25mm leakage |
1.48E-03 |
|
Full bore rupture of piping |
8.61E-05 |
||
|
Catastrophic failure of pressure vessel |
9.00E-05 |
||
|
Biogas Holder |
25mm leakage |
7.40E-04 |
|
|
Full bore rupture of piping |
7.80E-05 |
||
|
Catastrophic failure of pressure vessel |
3.04E-05 |
||
|
H2S Removal |
25mm leakage |
3.30E-04 |
|
|
Full bore rupture of piping |
6.00E-05 |
||
|
Catastrophic failure of pressure vessel |
3.00E-05 |
||
|
Booster |
25mm leakage |
1.00E-04 |
|
|
Full bore rupture of piping |
2.00E-05 |
||
|
Dehumidifier |
25mm leakage |
1.24E-04 |
|
|
Full bore rupture of piping |
4.80E-06 |
||
|
Catastrophic failure of pressure vessel |
1.00E-05 |
||
|
Siloxane Removal |
25mm leakage |
4.21E-04 |
|
|
Full bore rupture of piping |
4.20E-06 |
||
|
Catastrophic failure of pressure vessel |
4.00E-05 |
Consequence
Analysis
8.6.26
Consequence
modelling has been performed using PHAST based on approach described in
Section 8.4 . It should be noted that both flammable and toxic (H2S)
effects were modelled in consequence analysis. The consequence analysis results
are presented in Appendix
8.8.
Risk
Summation
8.6.27
During
construction of the New West Plant from year 2025 to year 2029, the existing
biogas facilities in the West and East side of TPSTW would be in operation.
Demolition of existing facilities and redevelopment of new facilities in the
existing West Plant would occur from year 2029 to year 2033, and during this
period, only the existing biogas facilities on the East side of TPSTW would be
in operation. Operational Phase would start in year 2036, covering full
operation of new and existing facilities within the Project site.
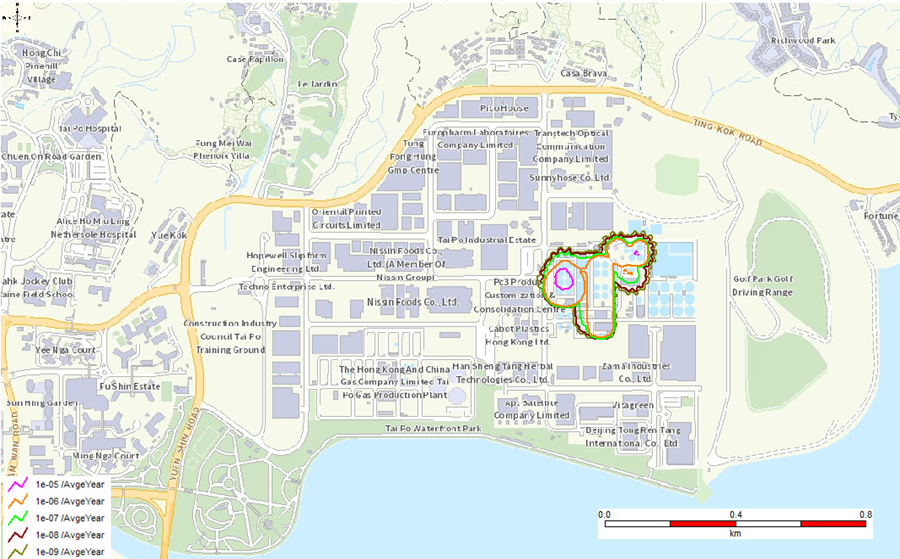
Individual Risk
Contours
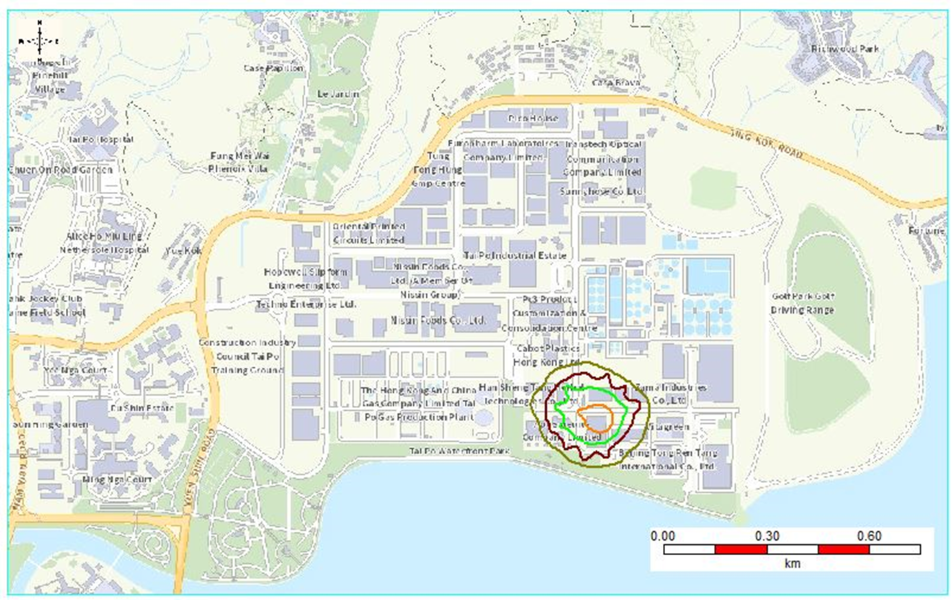
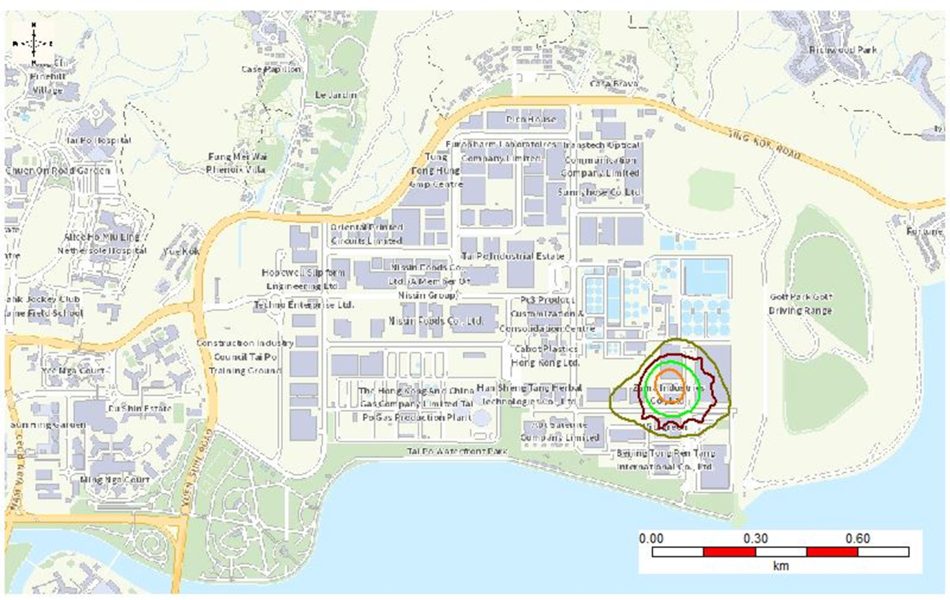
8.6.28
The
individual risk contours for the various study cases are presented in Exhibit
8.7, Exhibit
8.8, and Exhibit
8.9.
8.6.29
A
salient finding is that the 1 x 10⁻⁵ per year contour is
highly localized within the immediate area around the plant equipment
for both the 2025 and 2030 cases. During operational phase in 2036, the
1 x 10⁻⁵ per year contour is found to be present but is well
contained within the TPSTW site. As such, it is concluded that the individual
risk criterion of HKRG has been met.
Exhibit 8.7 Individual Risk Contours – Construction of New West Plant in
Proposed Expansion Site
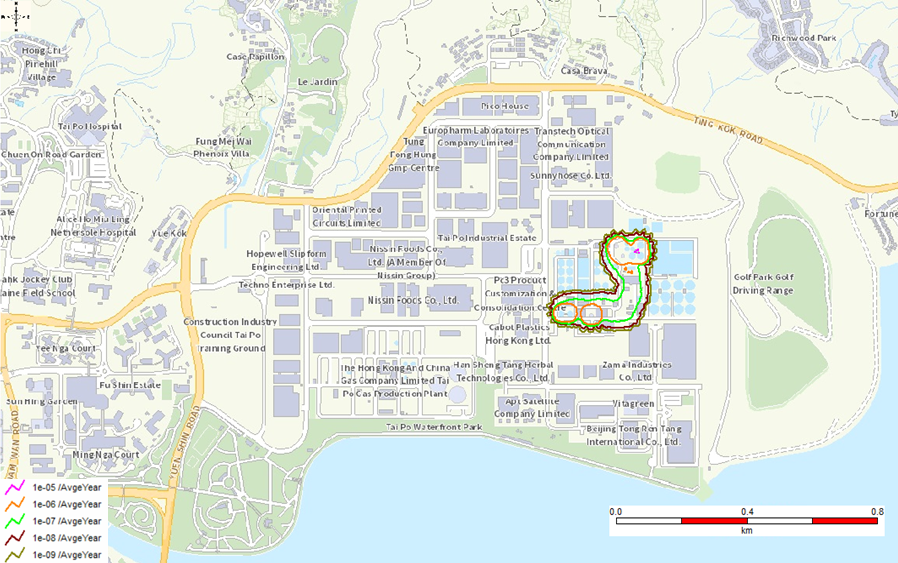
Exhibit 8.8 Individual Risk Contours – Construction in Existing West Plant
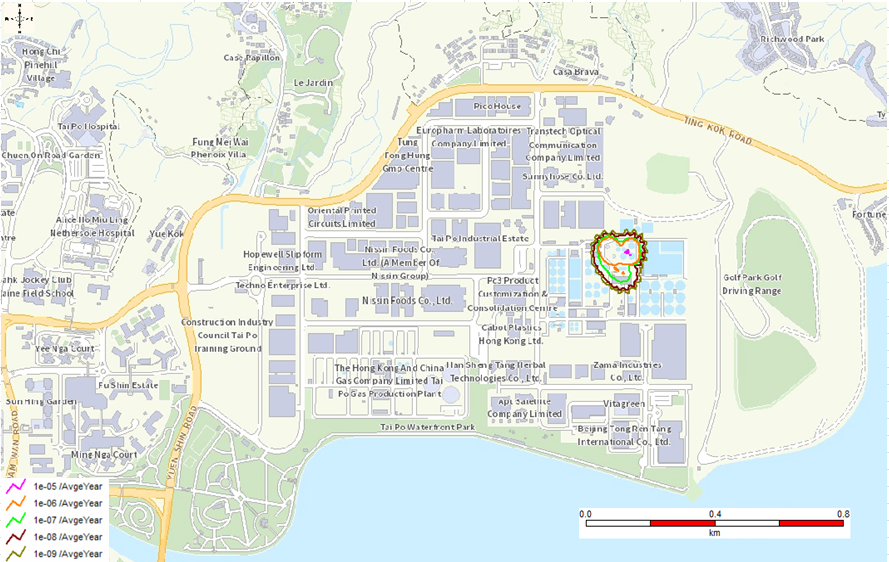
Exhibit 8.9 Individual Risk Contours – Operational Phase