Long Term Trends of E.coli Levels
5.37 The 20-year long term monitoring data showed that the level of E.coli in the Southern WCZ has remained low and stable. For North Western WCZ, considerable long-term increases of E.coli were observed at NM1 and NM5 during 1988-2005. The former may be related to pollution in Victoria Harbour and other discharges around Castle Peak Road, while the latter to effluents discharged from the San Wai Sewage Treatment Works and Pillar Point Sewage Treatment Works. Based on EPD’s long term monitoring data, the E.coli levels at NM1 appeared to increase after commissioning of HATS Stage 1 in 2001.
5.38 Increasing trends of E.coli levels were observed in the eastern and central Victoria Harbour before the implementation of HATS Stage 1 in late 2001. After the implementation of HATS Stage 1 in late 2001, the increasing trends of E.coli formerly observed in the Victoria Harbour ceased. The reduction of sewage related bacteria in the last few years was also evident in Eastern Buffer WCZ and Junk Bay WCZ after the implementation of HATS Stage 1 in late 2001.
5.39 For Western Buffer WCZ, considerable increases of sewage bacteria were observed in central and northern part of the WCZ (i.e. stations WM2, WM3 and WM4) since 2001. The increases in the E.coli levels at WM2, WM3 and WM4 were probably caused by the effluent discharged from the SCISTW under HATS Stage 1 which was implemented in late 2001.
HATS Survey Data
5.40 Two marine water sampling events were conducted under the Minor Works Contract ([2]) in December 2004 and May 2005 respectively to collect marine water samples for chemical analysis of nine CBP compounds (namely bromoform, chloroform, bromodichloromethane, dibromochloromethane, bromoacetic acid, chloroacetic acid, dibromoacetic acid, dichloroacetic acid and trichloroacetic acid). During each sampling event, replicate depth-integrated samples (composite of samples from near-surface, mid-depth and near-bottom) were collected at two marine stations, one near the existing outfall of SCISTW, namely SCI-1, and one at EPD’s monitoring station, namely SM18, in Southern WCZ. Locations of these monitoring stations are shown in Figure 5.1.
5.41 In February 2006, triplicate depth-integrated samples were collected at SCI-1 and SM18 under this EIA for laboratory analysis of TRC and the other 25 identified CBP compounds.
5.42 Total (soluble plus insoluble) concentrations of CBP were measured in the marine water samples. Table 5.15 shows the maximum values measured in the samples. All the maximum levels were below the detention limits except for methylene chloride where its maximum level measured at station SM18 was 55 mg/l. No reason can be offered to explain the detection of methylene chloride at Station SM18. It should be noted that the chemical analysis was conducted by a HOKLAS accredited laboratory. Also, methylene chloride was detected in all three water samples collected at SM18, with satisfactory QA/QC results.
Table 5.15 Maximum Ambient Levels for TRC and CBP
|
Parameters |
Station SCI-1 (mg/L) |
Station SM18 (mg/L) |
|
Total residual chlorine |
<20 |
<20 |
|
Bromoform |
<5 |
<5 |
|
Bromodichloromethane |
<5 |
<5 |
|
Chloroform |
<5 |
<5 |
|
Dibromochloromethane |
<5 |
<5 |
|
Bromacetic acid |
<2 |
<2 |
|
Chloroacetic acid |
<2 |
<2 |
|
Dibromoacetic acid |
<2 |
<2 |
|
Dichloroacetic acid |
<2 |
<2 |
|
Trichlroacetic acid |
<2 |
<2 |
|
Methylene chloride |
<20 |
55 |
|
Carbon tetrachloride |
<0.5 |
<0.5 |
|
Chlorobenzene |
<0.5 |
<0.5 |
|
1,1-dichloroethane |
<0.5 |
<0.5 |
|
1,2-dichloroethane |
<0.5 |
<0.5 |
|
1,1-dichloroethylene |
<0.5 |
<0.5 |
|
1,2-dichloropropane |
<0.5 |
<0.5 |
|
Tetrachloroethylene |
<0.5 |
<0.5 |
|
1,1,1-trichloroethane |
<0.5 |
<0.5 |
|
1,1,2-trichloroethane |
<0.5 |
<0.5 |
|
Trichloroethylene |
<0.5 |
<0.5 |
|
2-chlorophenol |
<0.5 |
<0.5 |
|
2,4-dichlorophenol |
<0.5 |
<0.5 |
|
p-chloro-m-cresol |
<0.5 |
<0.5 |
|
Pentachlorophenol |
<2.5 |
<2.5 |
|
2,4,6-trichlorophenol |
<0.5 |
<0.5 |
|
Bis(2-chloroethoxy)methane |
<0.5 |
<0.5 |
|
1,4-dichlorobenzene |
<0.5 |
<0.5 |
|
Hexachlorobenzene |
<0.5 |
<0.5 |
|
Hexachlorocyclopentadiene |
<2.5 |
<2.5 |
|
Hexachloroethane |
<0.5 |
<0.5 |
|
1,2,4-trichlorobenzene |
<0.5 |
<0.5 |
|
Alpha-BHC |
<0.5 |
<0.5 |
|
Beta-BHC |
<1 |
<1 |
|
Gamma-BHC |
<1 |
<1 |
Beach Water Quality Monitoring Data
5.43 Although other bacteria may be present in the marine water, the WQO for bathing beaches focuses on E.coli bacteria because these have been proved to provide the best correlation with the illness rates associated with swimming (specifically skin and gastrointestinal illnesses). The E.coli data routinely collected by EPD were used to establish the baseline condition for the eight beaches in Tsuen Wan District. During the bathing/wet seasons (March to October), all gazetted beaches are monitored by EPD at least three times per month. The interval between the sampling occasions is maintained at 3 to 14 days. During non-bathing/dry seasons, gazetted beaches which remain open throughout the year are still monitored at least three times per month. During each beach monitoring visit, beach water samples are collected where the water depth is between thigh to waist depth i.e. about 0.6 to 1 metre depth for analysis of E. coli bacteria. The annual trends of geometric mean E.coli levels measured at the beaches provided in the EPD’s publication “20 years of Beach Water Quality Monitoring in Hong Kong” (which is the latest beach water quality report published by EPD at the time of the moment of preparing the EIA report) are presented in Table 5.16. Locations of the beaches are shown in Figure 5.3. As the HATS Stage I was commissioned in late 2001, the data shown in Table 5.16 cover the periods both before and after the commissioning of HATS Stage I.
Table 5.16 Annual Trend of E.coli Levels at Tsuen Wan Beaches
|
Beach |
Pre-HATS Stage 1 |
|
Post-HATS Stage 1 |
||||||||
|
1996 |
1997 |
1998 |
1999 |
2000 |
2001 |
2002 |
2003 |
2004 |
2005 |
||
|
Geometric Mean E.coli (per 100 ml) |
|||||||||||
|
WQO: 180 |
|||||||||||
|
Anglers' |
636 (8-6900) |
691 (27-9100) |
502 (26-6100) |
442 (17-7000) |
326 (15-4600) |
621 (16-6000) |
1169 (38-15000) |
693 (23-8100) |
619 (32-5100) |
895 (55-6600) |
|
|
Approach |
1164 (130-9800) |
1009 (50-9500) |
435 (94-3100) |
387 (52-3400) |
316 (12-4700) |
411 (55-3200) |
696 (17-6100) |
762 (61-6300) |
470 (18-2400) |
663 (68-8200) |
|
|
Casam |
483 (30-5000) |
609 (53-15000) |
239 (10-1800) |
231 (10-7400) |
209 (27-5500) |
233 (10-1900) |
741 (16-12000) |
702 (26-4900) |
594 (11-3600) |
716 (17-4100) |
|
|
Gemini |
512 (30-7400) |
458 (28-3500) |
399 (10-8900) |
350 (58-4200) |
258 (17-3700) |
323 (11-3300) |
1155 (38-12000) |
875 (80-6500) |
1102 (23-9000) |
1042 (27-19000) |
|
|
Hoi Mei Wan |
373 (67-2000) |
471 (28-10000) |
280 (14-1700) |
109 (5-870) |
177 (10-2900) |
199 (9-1400) |
547 (12-6900) |
442 (11-3800) |
287 (6-4700) |
641 (54-5200) |
|
|
Lido |
537 (23-2700) |
600 (71-8100) |
262 (10-2300) |
231 (15-5400) |
181 (19-4400) |
269 (24-1500) |
683 (29-4400) |
734 (28-6100) |
523 (27-6000) |
782 (30-15000) |
|
|
Ma Wan |
59 (4-630) |
110 (1-1300) |
92 (2-3300) |
51 (1-560) |
39 (1-840) |
133 (6-1800) |
201 (2-3200) |
159 (4-5300) |
101 (1-5200) |
132 (1-5200) |
|
|
Ting Kau |
2096 (100-7900) |
1583 (55-16000) |
1045 (130-5500) |
515 (40-3500) |
593 (46-7300) |
739 (76-7000) |
742 (6-6700) |
831 (40-6300) |
412 (27-5700) |
512 (35-4700) |
|
Shaded cell - the geometric mean value exceeded the WQO
Data in brackets indicate the ranges
5.44 Of the eight beaches in the Tsuen Wan District, seven did not meet the WQO for bathing beaches and remained closed in 2005. The pollution at Tsuen Wan beaches was partly caused by the discharge of sewage from squatter areas and other developments lacking adequate sewage facilities in the rural areas of Sham Tseng as well as the influence from the polluted marine water from the Rambler Channel due to the expedient connections, misconnections and polluted surface runoff from the dense urban areas in Tsuen Wan, Kwai Chung and Tsing Yi Districts. The extension of the public sewer and connection of unsewered villages along Castle Peak Road (behind many of the Tsuen Wan beaches) is still on-going. Water quality problems along the Tsuen Wan coastline has been further affected by undisinfected effluent discharged from SCISTW since the commissinong of HATS Stage 1 in late 2001. Although Stage 1 of the Harbour Area Treatment Scheme (HATS) has brought about substantial water quality improvements to the Victoria Harbour, it has also concentrated the discharge of 1.4 million m3 per day of un-disinfected effluent from previously (pre-HATS Stage 1) dispersed sources along the coasts of Kowloon and eastern Hong Kong Island to a single point, i.e., the Stonecutters Island Sewage Treatment Works (SCISTW) outfall. Under the influence of prevailing tides and currents in the harbour, the net effect is increased E. coli levels at most of the bathing beaches along the Tsuen Wan coast. Together with water pollution caused by local sources such as sewage from upland unsewered villages or squatter areas, the un-disinfected effluent from SCISTW has exacerbated the already unsatisfactory beach water quality in Tsuen Wan.. The beach monitoring data are graphically presented in the figure below.
Annual Trend of Geometric Mean E.coli Levels Measured at Tsuen Wan Beaches:
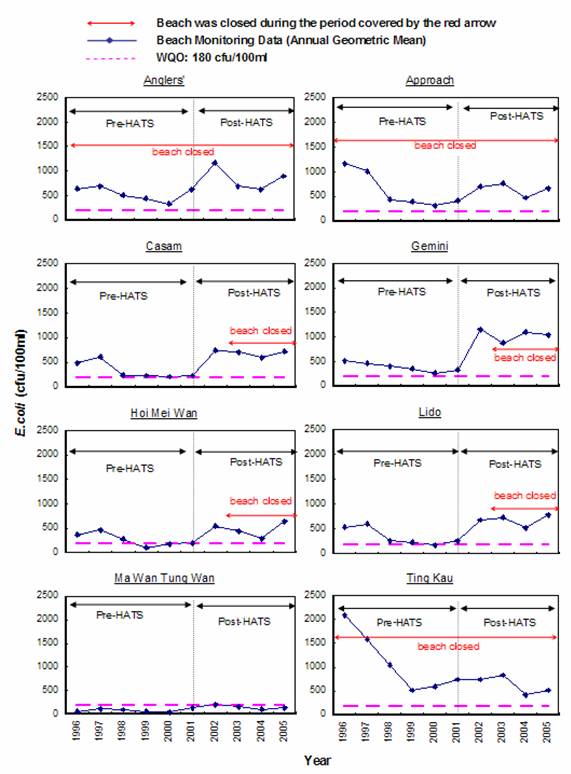

5.45 Before commissioning of HATS Stage 1, three beaches on the Tsuen Wan coast, namely Anglers’, Approach and Ting Kau, had been closed due to strong influence of local pollution sources as mentioned in Section 5.44. In general, the E.coli levels measured at the beaches showed a decreasing trend during the pre-HATS period from 1996 to 2000 as a result of local sewerage improvement works but the E.coli levels still exceeded the WQO at six beaches, namely Anglers’, Approach, Casam, Gemini, Lido and Ting Kau, in year 2000 before commissioning of HATS Stage 1 (Table 5.16). After commissioning of HATS Stage 1 in late 2001, the beaches have been further affected by the undisinfected effluent from SCISTW. The undisinfected effluent from HATS Stage 1 has caused four other beaches on the coast to close. They are, namely Lido, Casam, Hoi Mei Wan, and Gemini. Provision of the advance disinfection facilities (ADF) at the SCISTW is expected to help restore the water quality at Tsuen Wan coast to the pre-HATS Stage 1 status, thus giving the prospect for re-opening of the beaches at Lido, Casam, Hoi Mei, and Gemini. However, the beaches on Tsuen Wan coast are also subject to influence of local pollution sources, and the more ideal water quality for swimming can only be achieved when these pollution problems are tackled through local sewerage improvement work.
Assessment Methodology
Construction Phase
5.46 Construction of the Project would not involve marine works such as dredging or filling. The construction works would be land-based and would be designed not to affect normal operation of the SCISTW and the sewage effluent quality. The major construction activities for the Project are described in Sections 2.11 and 2.12. Construction phase water quality issues would include the impacts from site run-off, sewage from workforce, accidental spillage and discharges of wastewater from various construction activities. The potential impact from these activities was reviewed. Practical water pollution control measures / mitigation proposals were recommended to ensure that any effluent discharged from the construction site would comply with the criteria of WPCO.
Operational Phase
Far Field Modelling Tools
5.47 Computer modelling was used to assess the potential impacts on water quality in Victoria Harbour associated with the operation of the Project. The Delft3D suite of models, namely Delft3D-FLOW and Delft3D-WAQ, developed by Delft Hydraulics, were used as the platforms for hydrodynamic and water quality modelling respectively. Delft3D is a state-of-the-art computer program that simulates three-dimensional flow and water quality processes and is capable of handling the interactions between different processes.
5.48 Delft3D-FLOW is a 3-dimensional hydrodynamic simulation programme with applications for coastal, river and estuarine areas. The model calculates non-steady flow and transport phenomena that result from tidal and meteorological forcing on a curvilinear, boundary fitted grid.
5.49 Delft3D-WAQ is a water quality model framework for numerical simulation of various physical, biological and chemical processes in 3 dimensions. It solves the advection-diffusion-reaction equation for a predefined computational grid and for a wide range of model substances.
5.50 In the present study, the detailed HATS model developed using Delft3D-FLOW and Delft3D-WAQ was employed for simulation of the water quality changes due to the provision of disinfection facilities at the SCISTW. The detailed HATS model was originally developed and applied under the EEFS to assess the potential water quality impacts of different treatment and disposal scheme proposed for the HATS and the associated construction activities.
5.51 The detailed HATS model covers the North Western, Western Buffer, Victoria Harbour, Junk Bay, Eastern Buffer and Southern WCZ. The model was extensively calibrated by comparing computational results with field measurements collected from the measurement campaign developed under the EEFS, and accepted by the EPD. Details of the modelling tools and model setup are provided in the Briefing Document “Tools for Water Quality Modelling” prepared under the EEFS.
5.52 The performance of the detailed HATS model in terms of its E.coli predictions was further reviewed under this EIA. Minor adjustment of the process coefficients for E.coli was made upon review of the monitoring data. Details of the performance of the detailed HATS model and the proposed model adjustment are given in Appendix 5-3. Set up of the detailed HATS model such as the meteorological forcing, flow aggregation, wind condition, initial and boundary conditions is based on the EEFS. The model accuracy and limitations are discussed in Appendix 5-2a.
5.53 The detailed HATS Model is linked to the regional Update Model, which was constructed, calibrated and verified under the project “CE42/97 Update on Cumulative Water Quality and Hydrological Effect of Coastal Development and Upgrading of Assessment Tool” (Update Study). Computations were first carried out using the Update Model to provide open boundary conditions to the detailed HATS Model. The Update model covers the whole Hong Kong and the adjacent Mainland waters including discharges from the Pearl River. The influence on hydrodynamics and water quality in these outer regions would be fully incorporated into the detailed HATS Model.
Simulation Periods
5.54 For each assessment scenario, the simulation period of the hydrodynamic model covered two 15-day full spring-neap cycles (excluding the spin-up period) for dry and wet seasons respectively. The hydrodynamic results were used repeatedly to drive the water quality simulations for 30 days (excluding the spin-up period) for each of dry and wet seasons as specified in the EIA Study Brief. A spin-up period of 8 days and 30 days was provided for hydrodynamic simulation and water quality simulation respectively. In order to determine whether sufficient spin-up period is provided for the simulation, a test was conducted by repeating the model run for one more simulation period. It was found that the results of the two successive model runs were consistent with each other, which indicated that the spin-up period was sufficient.
Model Setup for Discharges
5.55 The Pearl River estuary flows as well as the effluent flow from the SCISTW were incorporated in the hydrodynamic model. Flows from other storm and sewage outfalls within the whole Hong Kong waters are relatively small and would unlikely change the hydrodynamic regime in the area and were therefore not included in the hydrodynamic model.
5.56 The diurnal flow variation of the Project effluent was incorporated in both the hydrodynamic and water quality model. The daily flow patterns measured at the SCISTW during August 2004 and January 2005 were reviewed. The review indicated that there was no substantial change in the diurnal patterns between the dry and wet seasons. The typical diurnal flow pattern measured at the SCISTW as shown in Table 5.17 below was applied to the projected daily Project flow and load to derive the hourly diurnal flow and load for different year horizons as model inputs. The same 24-hour diurnal flow pattern was used in the model throughout the simulation periods. The exact vertical and horizontal grid cell(s) of the 3D far field model into which the Project flow and pollution loading were allocated were determined by the near field modelling as detailed in Appendix 5-1.
Table 5.17 Typical Hourly Flow Pattern for the Project Effluent
|
Hour |
% of Daily Flow |
Hour |
% of Daily Flow |
Hour |
% of Daily Flow |
Hour |
% of Daily Flow |
|
0:00 |
4.45% |
6:00 |
2.53% |
12:00 |
5.03% |
18:00 |
4.83% |
|
1:00 |
3.70% |
7:00 |
2.74% |
13:00 |
4.94% |
19:00 |
4.90% |
|
2:00 |
3.48% |
8:00 |
3.32% |
14:00 |
4.81% |
20:00 |
4.96% |
|
3:00 |
3.17% |
9:00 |
3.89% |
15:00 |
4.27% |
21:00 |
5.94% |
|
4:00 |
2.90% |
10:00 |
4.80% |
16:00 |
4.29% |
22:00 |
5.06% |
|
5:00 |
2.66% |
11:00 |
4.86% |
17:00 |
4.40% |
23:00 |
4.07% |
5.57 Loading from the rest of the sewage outfalls was allocated in the bottom water layer. Pollution loads from storm outfalls and other point source discharges were specified in the middle layer of the water quality model.
5.58 Sodium hypochlorite and sodium bisulphite would be adopted as the chlorination agent and dechlorination agent respectively in the latest scheme of this Project. Bench-scale tests were conducted using CEPT effluent to estimate the chlorine demand and chlorine residual for meeting the geometric mean E.coli standards of 20,000 and 200,000 counts per 100 ml. The tests were conducted by HOKLAS accredited laboratories appointed by DSD in 2002 and 2005. Based on the data of the bench-scale chlorination studies, the recommended sodium hypochlorite and sodium bisulphite dosages for chlorination / dechlorination under different phases of HATS are summarized in Table 5.18.
Table 5.18 Recommended Sodium Hypochlorite and Sodium Bisulphite Dosages for HATS
|
Description |
Operational Range |
|
|
Advance Disinfection Facilities (ADF) Stage to meet the E.coli standard of 200,000 counts per 100 ml |
||
|
Minimum Chlorine Contact Time |
6.6 minutes (under peak flow condition) |
|
|
Sodium Hypochlorite Dosage (mgCl2/L) |
11 - 15 |
|
|
Sodium Bisulphite Dosage(mgNaHSO3/l) |
Automatic Mode |
4 – 7 |
|
Manual Mode |
8 – 11 |
|
|
Stage 2A Disinfection Facilities to meet the E.coli standard of 20,000 counts per 100 ml |
||
|
Minimum Chlorine Contact Time |
20 minutes (under peak flow condition) |
|
|
Sodium Hypochlorite Dosage (mgCl2/L) |
10 – 14 |
|
|
Sodium Bisulphite Dosage (mgNaHSO3/l) |
2 – 4 |
|
|
Stage 2B Disinfection Facilities to meet the E.coli standard of 20,000 counts per 100 ml |
||
|
Minimum Chlorine Contact Time |
20 minutes (under peak flow condition) |
|
|
Sodium Hypochlorite Dosage (mgCl2/L) |
2 - 3 |
|
|
Sodium Bisulphite Dosage (mgNaHSO3/l) |
1 - 2 |
|
5.59 Under the advance disinfection facilities (ADF) stage, two operation modes are developed for the control of chemical dosages – Manual Operation Mode and Automatic Operation Mode. The difference between the two operation modes is the methods for measuring the TRC levels at the outlet of the chlorination system. Under Automatic Operation Mode, dosages of dechlorination agent (i.e. sodium bisulphite) are adjusted automatically following sewage flow rate and online TRC measurements at the outlet of the chlorination system. The TRC measurements are conducted continuously e.g. at 15-min intervals. Thus, dechlorination chemical can be adjusted based on the TRC data every 15 minutes. Under Manual Operation Mode, chemical dosages are adjusted based on sewage flow rate and manual TRC measurement. Practically, hourly TRC measurements are conducted during the Manual Operation Mode and dechlorination chemical is adjusted based on the TRC data every hour. A higher dechlorination chemical would be provided to ensure zero TRC in the discharge during the Manual Operation Mode and to allow sufficient safety margin to offset the potential fluctuation of TRC between the hourly measurements. Automatic Operation Mode would be the key control mode for SCISTW chlorination system, while Manual Operation Mode will be provided to allow operation flexibility and reliability in case of online TRC analyzer failure. As a conservative approach, the assessment of water quality impacts has been based on the chemical dosages under Manual Operation Mode.
5.60 At the ADF stage, provision of a new chlorine contact tank to increase the effectiveness of chlorination is not feasible. The existing effluent culvert system would be used for chlorine contact at the ADF stage and the chlorine contact times would be less than 10 minutes. At Stage 2A and Stage 2B, the effluent flow rates would be considerably larger than the ADF flow. A more stringent effluent E.coli standard of 20,000 counts per 100 ml was therefore proposed. Under Stage 2A, a new chlorine contact tank would be built at the SCISTW to increase the chlorine contact time for the HATS effluent so as to effectively achieve the required disinfection level. Although the recommended dosage for ADF stage would be slightly higher than that for Stage 2A, the resulted disinfection level for ADF would be lower than that for Stage 2A due to the short contact time available under the ADF stage.
Effluent Characteristics
5.61 Laboratory pilot tests were conducted for the CEPT effluent from SCISTW and the secondary treated effluent from Tai Po Sewage Treatment Works (TPSTW) and Sha Tin Sewage Treatment Works (STSTW). The pilot tests aimed to simulate the chlorination and dechlorination process for sewage effluent and to determine the chemical characteristics of the chlorinated/dechlorinated (C/D) effluents. Table 5.19 summarizes the chemical analysis results. Of the 34 CBP’s tested, only 8 were detected in the C/D CEPT effluent, the concentrations of 6 were less than 10 parts per billion while those for the remaining 2 were in the 10-50 parts per billion range. However, 5 of these 8 CBPs were also detected in the raw CEPT effluent before chlorination and dechlorination. Of these 5, the concentrations of 3 were less than 10 parts per billion while the remaining two had concentrations in the 10-50 parts per billion range. These results indicated that of the few CBP’s detected, the majority was already present in the raw CEPT effluent, and the chlorination and dechlorination process introduced 3 CBP’s all showing concentrations of less than 10 parts per billion. The laboratory results also showed that the THM and HAA formed were in the parts per billion concentration range, well below USEPA’s drinking water standard for THM and HAA. The chemical analysis results are also discussed in Sections 7.16 and 7.17. The laboratory results for C/D CEPT effluent were used to assess the water quality impacts due to the effluent discharged from SCISTW during HATS ADF stage and Stage 2A. The results for C/D secondary treated effluent were used to assess the water quality impacts during HATS Stage 2B where the SCISTW would be upgraded to secondary treatment. The pilot tests were performed using a chlorine dosage of 15 and 20 mg/l for the CEPT effluent and 5 and 9 mg/l for the secondary treated effluent. The chlorine dosages adopted in the pilot tests are larger than the recommended dosages as shown in Table 5.18, which would provide conservative assessment.
Table 5.19 Summary of Chemical Analysis Results
|
Parameters |
Raw CEPT Effluent |
C/D CEPT Effluent |
Raw Secondary Treated Effluent |
C/D Secondary Treated Effluent |
|
Ammonia (mg/l) |
18 - 30 |
(17.4 – 21.5) |
1.27 – 1.41 |
(0.43 – 1.16) |
|
Sulfite (mg/l) |
<0.1 – 1.5 |
(<0.1 – 1.5) |
<0.1 |
0.7 |
|
Total residual chlorine (mg/l) |
<0.02 |
(0.02 - 0.1) |
<0.02 |
<0.02 |
|
Bromoform (mg/L) |
<5 |
<5 |
<5 |
(32 – 49) |
|
Bromodichloromethane (mg/L) |
<5 |
<5 |
<5 |
<5 |
|
Chloroform (mg/L) |
<5 to 5 |
(<5 – 7) |
<5 |
<5 |
|
Dibromochloromethane (mg/L) |
<5 |
<5 |
<5 |
(<5 – 8) |
|
Bromoacetic acid (mg/L) |
<2 |
<2 |
<2 |
<2 |
|
Chloroacetic acid (mg/L) |
<2 |
(<2 – 4) |
<2 |
<2 |
|
Dibromoacetic acid (mg/L) |
<2 |
(<2 – 4) |
<2 |
(6 – 10) |
|
Dichloroacetic acid (mg/L) |
11 to 17.3 |
(20 - 45.9) |
<2 |
<2 - 3 |
|
Trichlroacetic acid (mg/L) |
4.7 to 10 |
(7.19 – 22) |
<2 to 2 |
(4 – 7) |
|
Methylene chloride (mg/L) |
<20 |
<20 |
<20 |
<20 |
|
Carbon tetrachloride (mg/L) |
<0.5 |
<0.5 |
<0.5 |
<0.5 |
|
Chlorobenzene (mg/L) |
<0.5 |
<0.5 |
<0.5 |
<0.5 |
|
1,1-dichloroethane (mg/L) |
<0.5 |
<0.5 |
<0.5 |
<0.5 |
|
1,2-dichloroethane (mg/L) |
<0.5 |
<0.5 |
<0.5 |
<0.5 |
|
1,1-dichloroethylene (mg/L) |
<0.5 |
<0.5 |
<0.5 |
<0.5 |
|
1,2-dichloropropane (mg/L) |
<0.5 |
<0.5 |
<0.5 |
<0.5 |
|
Tetrachloroethylene (mg/L) |
1.0 to 1.3 |
(0.5 - 1.3) |
<0.5 |
<0.5 |
|
1,1,1-trichloroethane (mg/L) |
<0.5 |
<0.5 |
<0.5 |
<0.5 |
|
1,1,2-trichloroethane (mg/L) |
<0.5 |
<0.5 |
<0.5 |
<0.5 |
|
Trichloroethylene (mg/L) |
1.5 to 1.9 |
(1.1 – 2) |
<0.5 |
<0.5 |
|
2-chlorophenol (mg/L) |
<0.5 |
<0.5 |
<0.5 |
<0.5 |
|
2,4-dichlorophenol (mg/L) |
<0.5 |
<0.5 |
<0.5 |
<0.5 |
|
p-chloro-m-cresol (mg/L) |
<0.5 |
<0.5 |
<0.5 |
<0.5 |
|
Pentachlorophenol (mg/L) |
<2.5 |
<2.5 |
<2.5 |
<2.5 |
|
2,4,6-trichlorophenol (mg/L) |
<0.5 |
(1 – 2) |
<0.5 |
<0.5 |
|
Bis(2-chloroethoxy)methane (mg/L) |
<0.5 |
<0.5 |
<0.5 |
<0.5 |
|
1,4-dichlorobenzene (mg/L) |
<0.5 |
<0.5 |
<0.5 |
<0.5 |
|
Hexachlorobenzene (mg/L) |
<0.5 |
<0.5 |
<0.5 |
<0.5 |
|
Hexachlorocyclopentadiene (mg/L) |
<2.5 |
<2.5 |
<2.5 |
<2.5 |
|
Hexachloroethane (mg/L) |
<0.5 |
<0.5 |
<0.5 |
<0.5 |
|
1,2,4-trichlorobenzene (mg/L) |
<0.5 |
<0.5 |
<0.5 |
<0.5 |
|
Alpha-BHC (mg/L) |
<0.5 |
<0.5 |
<0.5 |
<0.5 |
|
Beta-BHC (mg/L) |
<1 |
<1 |
<1 |
<1 |
|
Gamma-BHC (mg/L) |
<1 |
<1 |
<1 |
<1 |
Note: Data in brackets indicate the ranges.
Whole Effluent Toxicity Test
5.62 Whole effluent toxicity test (WETT) was conducted to determine the whole effluent toxicity of C/D CEPT effluent from SCISTW and C/D secondary treated effluent from TPSTW and STSTW for the following five local marine species:
l Amphipod (Melita longidactyla), with 48-hour survival test
l Barnacle larvae (Balanus amphitrite), with 48-hour survival test
l Fish (Lutjanus malabaricus), with 48-hour survival test
l Shrimp (Metapenaeus ensis), with 48-hour survival test
l Diatom (Skeletonema costatum), with 7-day growth inhibition test
5.63 The toxicity tests for amphipod, barnacle larvae, fish and shrimp were conducted to determine the acute toxicity of the effluents to the 4 animal species while the toxicity tests for diatom were to determine the chronic toxicity of the effluents to the plant species. The species chosen and the testing protocols used for the WETT were developed by a previous study commissioned by Agriculture, Fisheries and Conservation Department (AFCD) and were accepted by EPD and AFCD. It should be noted that the WETT results reflected the cumulative effects of all CBP species and other toxic contaminants (such as ammonia and heavy metals) that may be present in the raw CEPT effluent. The WETT results are summarized in Sections 5.162 to 5.166.
Modelling Scenarios for Normal Operation
5.64 According to the Brief, construction of the Project (i.e. disinfection facilities) is tentatively scheduled to commence in 2007 for completion by 2009 (ADF stage). HATS Stage 2 would be implemented in two phases, namely Stage 2A and Stage 2B. For the purpose of water quality modelling, it is assumed that Stage 2A and Stage 2B would be implemented by 2014 and 2021 respectively.
5.65 The time horizons for operational phase assessment and the assumed Project flow rates are shown in Table 5.20. The Project flow rates were estimated using the latest population and employment forecast (i.e. 2003-based Territorial Population and Employment Data Matrices) provided by Planning Department and the unit flow factors from the GESF ([3]). Assumptions for calculating the Project flow rates are given in Appendix 5-2. The Project flow rates were compiled using the latest information available at the time when the water quality model was set up for this EIA. Based on the flow projection exercise being conducted under the on-going HATS Stage 2A EIA Study using the latest set of planning data obtained from Planning Department for the HATS catchment, the projected flows in the assessment years would likely be less than those shown in Table 5.20 and Table 5.21. The Project flow rates adopted in this water quality modelling exercise are therefore considered conservative.
Table 5.20 Modelling Scenarios for Operational Phase Impact Assessment
|
Scenario |
Year |
Stage |
Assumed Flow Rate (m3/day) |
Assumed E.coli Counts – Geometric Mean (no. per 100 ml) |
Required Chlorine Dosage (mg/l) |
Assumed TRC Level - 95%ile value (mg/l) |
|
1b |
2009 |
Early Commissioning of ADF |
1576300 |
200,000 a |
11-15 |
0.2 |
|
2b |
2013 |
Late ADF Stage |
1661100 |
200,000 a |
11-15 |
0.2 |
|
2c (Sensitivity Test) |
2013 |
Late ADF Stage |
1661100 |
2,000,000 |
10-14 |
0.2 |
|
3b |
2020 |
Late Stage 2A with disinfection |
2341600 |
20,000 a |
10-14 |
0.2 |
|
3c (Sensitivity Test) |
2020 |
Late Stage 2A with disinfection |
2341600 |
200,000 a |
10-13 |
0.2 |
|
4b |
Ultimate |
Late Stage 2B with disinfection |
2800000 b |
20,000 a |
2-3 |
0.2 |
Notes: a – Equivalent to 99% or above E. coli removal
b – The flow rate of 2.8M m3 per day was used in this EIA for conservative assessment. The recent flow projection conducted under the on-going HATS Stage 2A EIA Study indicated that the ultimate flow rate should be less than 2.8M m3 per day
5.66 Two time horizons (2009 and 2013 respectively) were considered for the ADF stage as there would be changes in the coastline configurations and the background pollution discharges within the Study Area between these two years. On the other hand, year 2021 was assumed to be the time horizon for implementation of Stage 2B for assessment purpose of this EIA Study. Thus, year 2020 would represent the late phase of Stage 2A just before the commissioning of Stage 2B.
5.67 It was assumed that CEPT with continuous disinfection would be provided for the Project effluent under ADF stage and Stage 2A. In addition, secondary treatment with continuous disinfection would be provided under Stage 2B (for ultimate scenario).
5.68 An annual geometric mean value and a 95 percentile (%ile) value were specified for the E.coli discharge standards whereas a 95%ile value and a maximum discharge limit were specified for the TRC standards. The geometric mean value and the 95%ile value were adopted as the effluent concentrations for E.coli and TRC respectively as shown in Table 5.20.
5.69 Scenario 1b, Scenario 2b, Scenario 3b and Scenario 4b as shown in Table 5.20 are the base case scenarios for water quality modelling. The proposed E.coli standards for these base case scenarios (i.e. 200,000 counts per 100 ml for ADF and 20,000 counts per 100 ml for Stage 2A and Stage 2B, both equivalent to 99% or above E. coli removal) were derived with reference to the findings of the previous EIA Study for SSDS Stage 1 and the HATS EEFS, as well as the finding of the water quality impact assessment carried out under this EIA Study. These proposed effluent standards were only used in this EIA as the base case for water quality modelling. Based on the results of the base case modelling, additional model runs (namely Scenario 2c and Scenario 3c as shown in Table 5.20) were performed by adjusting the disinfection level to determine the optimum chlorine dosage for the disinfection facilities. The objective was to, on one hand, protect the beneficial uses of water sensitive receivers, and on the other hand, minimize the chlorine dose and thus the potential for generation of CBP. The results of the base case modelling and the rationales for deriving the sensitivity tests (namely Scenario 2c and Scenario 3c and Scenario 4b) are detailed in Sections 5.125 to 5.149.
5.70 Based on the recommendation of EEFS, the TRC standards for HATS effluent were set at 0.2 mg/l (95%ile) and 0.4 mg/l (maximum). The adequacy of the proposed TRC standards was assessed by means of water quality modelling. The TRC levels in the receiving waters as predicted by the water quality model are compared against the ambient water quality objectives to evaluate the potential impacts. The adequacy of the proposed TRC standards in terms of their human health and ecological risks are discussed in Section 6.
5.71 The adverse assumption of using the 95%ile value (0.2 mg/l) as the initial HATS effluent concentration for continuous discharge was adopted for water quality modelling. This model input is considered conservative, given that 95%ile of the TRC loads are usually about twice their mean values. The pilot test data presented in Table 5.19 also showed a TRC range of 0.02 to 0.1 mg/l. Thus, the water quality impacts simulated were likely to be higher than the real situation that would happen.
5.72 In addition, four scenario runs (Scenario 1a, Scenario 2a, Scenario 3a and Scenario 4a) for the case without the Project were included to give the baseline conditions for the four selected time horizons (see Table 5.21). The baseline conditions assumed that no disinfection facility would be provided at the SCISTW. The purpose of performing the baseline scenarios was to quantify the E.coli impacts due to the undisinfected effluent from SCISTW to demonstrate the need for this Project. The net impact due to continuous disinfection at the SCISTW could also be quantified by comparing the results of different assessment scenarios.
Table 5.21 Modelling Scenarios for Baseline Conditions (Without the Project)
|
Scenario |
Description |
Assumed Flow Rate (m3/day) |
Assumed E.coli Level in the Undisinfected Effluent (no. per 100 ml) |
|
1a |
2009 with no ADF |
1576300 |
1.0E+7 (a) |
|
2a |
2013 with no ADF |
1661100 |
1.0E+7 (a) |
|
3a |
2020 Stage 2A with no disinfection |
2341600 |
1.0E+7 (a) |
|
4a |
Ultimate Stage 2B with no disinfection |
2800000 (c) |
2.96E+5 (b) |
Notes:
(a) The assumed E.coli level in undisinfected CEPT was based on the bench-scale chlorination tests conducted by DSD in 2002 and 2005.
(b) 95%ile value measured in the effluent from Sha Tin STW (secondary treatment plant) in 2001 (derived under the EIA Study for Tai Po STW Stage 5).
(c) The flow rate of 2.8M m3 per day was used in this EIA for conservative assessment. The recent flow projection conducted under the on-going HATS Stage 2A EIA Study indicated that the ultimate flow rate should be less than 2.8M m3 per day
5.73 The E.coli level in the undisinfected effluent of HATS Stage 2B would depend on the type of biological treatment process to be selected for HATS. The biological treatment process for HATS Stage 2B is however not yet decided. The E.coli level assumed for the HATS Stage 2B effluent (without disinfection) under Scenario 4a was based on the 95%ile value (2.96E+5 counts per 100 ml) measured in the secondary treated effluent from Sha Tin STW as derived under the EIA Study for Tai Po STW Stage 5. Based on “Wastewater Engineering Treatment Disposal Reuse, Metcalf & Eddy Third Edition”, the effluent E.coli level of a secondary process is in the range of 1E+5 to 1E+6 no. per 100 ml. The 95%ile value measured at Sha Tin STW was within this range and therefore a reasonable assumption for modelling. Review of recent effluent quality data (2001– 2005) obtained for several existing secondary treatment plants including Sha Tin STW, Tai Po STW and Yuen Long STW also revealed that the adoption of the E.coli value of 2.96E+5 counts per 100 ml is a reasonable assumption.
5.74 Under normal circumstances, the treated effluent would be discharged into the sea via the existing submarine outfalls of SCISTW. The submarine outfalls of SCISTW are shown in Attachment 1 of Appendix 5-1.
Sensitivity Test – Time Varying E.coli Loading
5.75 As mentioned above, the geometric mean E.coli effluent standards have been applied constantly throughout the simulation period for water quality modelling. As E.coli levels normally exhibit large fluctuations, the geometric mean, which reflects an average condition, may not be representative of situations having high E.coli levels. To address this concern, a sensitivity model run was conducted using a time varying E.coli loading for model input under the 2009 scenario. The loading input for this sensitivity test was derived from the E.coli levels measured in the chlorinated CEPT effluent from the bench-scale chlorination studies conducted by DSD in 2002 and 2005. Only those E.coli levels that were within the design range for meeting the effluent geometric mean standard of 200,000 no. per 100 ml were chosen for hourly model input which covered a simulation period of 22 days. The E.coli levels adopted for model input are given in Appendix 5-4a. The sensitivity test results are attached in Appendix 5-4b. The sensitivity results are compared with the base case results for 2009 where a constant geometric mean E.coli level of 200,000 no. per 100 ml was applied throughout the simulation period. The sensitivity results indicated that there is no significant difference in the geometric mean levels predicted at the Tsuen Wan beaches due to the use of time fluctuating loading for model input. Therefore, the assumption of using a constant geometric mean loading for modelling is reasonable.
Assumptions for TRC and CBP Modelling
5.76 The modelling scenarios have taken into account the discharge of TRC and CBP. A tracer was defined at the discharge location of the Project to determine the dilution in the vicinity of the discharge point. Tracers were also defined at other identified concurrent discharges for cumulative impact assessment. The dilution information was used to determine the decreases in the concentrations and to evaluate the potential impacts. The modelling of TRC was conducted using a decay rate of 24 per day ([4]). An even more conservative assumption of zero decay rate was applied to the CBP discharges.
5.77 Four major sewage effluent discharges were considered in the TRC and CBP modelling. They were the effluent from SCISTW, Pillar Point Sewage Treatment Works (PPSTW), Tai Po Sewage Treatment Works (TPSTW) and Sha Tin Sewage Treatment Works (STSTW) respectively. It should be noted that the effluent from TPSTW and STSTW would be discharged into the Victoria Harbour via the Kai Tak Nullah under the Tolo Harbour Effluent Export Scheme (THEES). UV radiation would be used as the disinfection method for TPSTW and STSTW. However, for the purpose of this water quality impact assessment and as a worst-case scenario study, chlorination and dechlorination were assumed to be the disinfection processes of the sewage effluent discharges from TPSTW and STSTW. Effluent from Sham Tseng STW and Siu Ho Wan STW was not included in the TRC modelling as UV disinfection is currently adopted for these two treatment works. Cumulative TRC and CBP impact from cooling water discharges within the Study Area was also incorporated into the model.
5.78 The initial TRC levels assumed in the effluent from TPSTW and STSTW as well as in the cooling water discharges are based on the assumptions adopted in the approved “EIA Study for Tai Po Sewage Treatment Works Stage 5”. The initial concentrations of CBP assumed in the TPSTW and STSTW effluents and the cooling water discharges are based on the maximum CBP levels measured in the C/D secondary treated effluent samples as shown in Table 5.19 above (please also refer to Sections 7.16 and 7.17). As the SCISTW would eventually be upgraded to secondary treatment, the initial CBP levels in the SCISTW effluent under the ultimate stage during Stage 2B are also based on the maximum values measured in the C/D secondary treated effluent. The initial CBP levels in the HATS effluent during ADF stage and Stage 2A are based on the maximum values measured in the C/D CEPT effluent samples collected from the SCISTW. The initial TRC and CBP levels in the C/D CEPT effluent from PPSTW were assumed to be the same as those in the C/D CEPT effluent from the SCISTW.
5.79 Modelling of TRC and CBP was to evaluate whether the Project discharges would cause any cumulative water quality impact with other concurrent discharges and to determine the size of the mixing zone for these compounds. The assumptions adopted for modelling of TRC and CBP represent the worst case scenarios for water quality impact assessment. Assessment of the acute and chronic toxicity of TRC and CBP was conducted under the Human Health and Ecological Risk Assessment in Sections 6 and 7.
Potential Oxygen Depletion Due to the Addition of Dechlorination Chemical
5.80 Sodium hypochlorite and sodium bisulphite would be adopted as the chlorination agent and dechlorination agent respectively. The operational range of sodium bisulphite dosage was derived from the data obtained from the bench-scale tests as shown in Table 5.18. The upper limit of operational range for sodium bisulphite dosage is 11 mg/l, 4 mg/l and 2 mg/l for ADF, Stage 2A and Stage 2B respectively and these upper values were assumed as the sodium bisulphite concentration in the Project effluent for water quality modelling. A conservative tracer (with zero decay rate) was defined in the far field model at the effluent discharge point to predict the sodium bisulphite concentrations in the marine water under normal operation. This would be a very worst case in terms of the predicted sodium bisulphite level in the marine water as it is assumed that the chemical does not react and remains inert. In reality, sodium bisulphite would not be inert as it would react with chlorine and other chemicals in the water.
5.81 The sodium bisulphite concentrations predicted by the far field water quality model were used to estimate the oxygen depletion in the marine water. For conservative assessment, it is assumed that all sodium bisulphite would undergo the following reaction with the oxygen in marine water:
2NaHSO3 (sodium bisulphite) + O2 (oxygen) à 2NaHSO4 (sodium bisulphate)
5.82 On a weight to weight basis, approximately 6.5 parts of sodium bisulphite would consume 1 part of oxygen. The level of oxygen depletion was calculated by dividing the predicted sodium bisulphite concentration in the marine water with a factor of 6.5. The level of oxygen depletion was then compared with the ambient DO levels predicted by the far field water quality model to determine the significance of the potential impact. The assessment focused on areas in the vicinity of the Project discharge point.
Modelling Scenarios for Emergency Situations
Temporary Discharge of Undisinfected Effluent
5.83 Water quality modelling was carried out to address the impact from the discharge of undisinfected effluent under temporary failure of disinfection facilities due to the lack of power supply as well as other incidents such as pump or equipment failure. The modelling also addressed the impacts from the discharge of undisinfected effluent in the event of temporary failure of dechlorination where the chlorination plant would need to be shutdown to avoid excessive discharge of TRC.
5.84 In the event of emergency situations when the disinfection facilities fail or are shutdown, treated (but undisinfected) effluent would be discharged into the sea via the submarine outfall of SCISTW. The North West Kowloon outfall which conveys effluent to a disposal point between the Cargo Handling Wharf and the North Fairway, forms a bypass to the HATS Stage 1 outfall. Sewage bypass is also available via other preliminary treatment works (PTW) within the HATS catcments. The bypass would be discharged via the submarine outfalls of the PTW except for Kwai Chung PTW where its submarine outfall was decommissioned. Emergency bypass at Kwai Chung PTW can only be discharged via the seawall bypass location. However, such sewage bypass would only happen when malfunctioning of the SCISTW submarine outfall or failure of the pumping units at the main treatment facilities of the SCISTW occurs or when equipment failure or power supply failure at the screening plant occurs. Only screened sewage would be discharged via these sewage bypass locations. As such, emergency discharge of treated (but undisinfected) effluent due to the failure of the disinfection facilities would only occur at the submarine outfall of SCISTW.
5.85 Modelling was carried out for six scenarios as shown in Table 5.22 to simulate the impact due to the shutdown of the disinfection facilities.
Table 5.22 Proposed Modelling Scenarios for Emergency Discharge of Undisinfected CEPT Effluent
|
Scenario |
Year |
Total Discharge Period (hours) |
Assumed E.coli Concentration in Undisinfected CEPT Effluent (no. per 100 ml) |
|
5a |
Year 2009 – ADF |
6 |
1.0E+7 (2) |
|
5b |
Year 2009 – ADF |
24 (1) |
|
|
6a |
Year 2013 – ADF |
6 |
|
|
6b |
Year 2013 – ADF |
24 (1) |
|
|
7a |
Year 2020 – Stage 2A |
6 |
|
|
7b |
Year 2020 – Stage 2A |
24 (1) |
Notes:
(1) Past emergency discharge records available from various sewage treatment works indicated that the longest period of emergency discharge would be less than 6 hours. Thus, emergency discharge for 24 hours is an extremely remote scenario for the purpose of worst-case assessment only.
(2) The assumed E.coli level in undisinfected CEPT are based on the bench-scale chlorination tests conducted by DSD in 2002 and 2005.
5.86 Year 2020 represents the worst case in terms of the E.coli loading from the undisinfected CEPT effluent. Year 2009 and Year 2013 are selected to address the effect during the ADF stage. Although the HATS flow under the ultimate scenario would be larger than that under Stage 2A, the E.coli concentration in the undisinfected secondary treated effluent would be much smaller than that in the undisinfected CEPT effluent. The impact due to emergency discharge under the ultimate scenario was therefore not assessed.
5.87 According to the information provided by DSD, emergency discharge has never occurred at the existing SCISTW. The historical records of emergency discharge at the PTW and STW in both HATS Stage 1 and HATS Stage 2 catchments were reviewed for the period from 2002 to 2005. The recorded emergency bypasses were due to prolonged or very heavy rainfall or failure of pumping stations at the PTW or STW. The longest duration of emergency discharge was 5 hours 27 minutes recorded at Northwest Kowloon Pumping Station in 2005 due to prolonged rainfall. Based on the historical records, emergency discharge due to power failure has not happened before at the Pillar Point PTW and San Wai PTW.
5.88 The proposed scenarios cover two different discharge period namely:
· a 6-hour period (which is a reasonable assumption based on past emergency discharge records) and
· a 24-hour period (which is a very adverse scenario as sensitivity test)
5.89 For the first scenario (namely Scenario 5a), four separate model runs were conducted using the far field model to simulate the impacts for four emergency discharge periods centred at namely neap tide high water, neap tide low water, spring tide mid-flood and spring tide mid-ebb respectively for both wet and dry seasons. The model results were analyzed to determine the sensitivity of the water quality impacts under different discharge times. The sensitivity results indicated that the water quality impact at the identified sensitive receivers would be relatively larger under the discharge periods centred at neap tide low water and spring tide mid-flood. These two tide conditions were therefore selected and modelled for both dry season and wet season under the remaining five scenarios (i.e. Scenarios 5b, 6a, 6b, 7a and 7b). Thus, four runs were performed for each scenario, i.e., two runs (neap low water and spring mid-flood respectively) for dry season and two runs (neap low water and spring mid-flood respectively) for wet season.
Temporary Discharge of Chlorinated Effluent
5.90 Failure of dechlorination could be caused by the malfunction of the pumping system or power failure at the dechlorination unit. It is considered that the plant operator would be notified immediately after any power failure or pump failure via the control system of the treatment plant. It is also considered that the chlorination dosing process could be practically stopped within 30 minutes upon notification of the dechlorination plant failure. It is therefore assumed in the modelling that when failure of dechlorination occurs, the reaction time to shut down the chlorination unit to avoid excessive discharge of TRC into the marine environment would be about 30 minutes. During the period when the dechlorination unit is failed, a higher level of TRC would be present in the effluent.
5.91 Table 5.23 shows the proposed emergency discharge scenarios. Scenario 8a and Scenario 9a would cover an emergency discharge period of 40 minutes which takes into account the reaction time for DSD to shut down the chlorination plant (30 minutes) plus the assumed chlorine retention time of 10 minutes. Scenario 10a would cover an emergency discharge period of 60 minutes which takes into account the reaction time for DSD to shut down the chlorination plant (30 minutes) plus the assumed chlorine retention time of 30 minutes. Stage 2B was not assessed as Stage 2A already represents the worst case in terms of the Project discharge.
Table 5.23 Proposed Modelling Scenarios for Emergency Discharge of TRC
|
Scenario |
Year |
Assumed Chlorine Retention Time (minute) |
Reaction Time to Shut Down the Chlorination Plant (minutes) |
Total Discharge Period |
Assumed Chlorine Residuals without Dechlorination (mg/l) |
|
8a |
Year 2009 – ADF |
10 |
30 |
40 minutes |
6.7 |
|
9a |
Year 2013 – ADF |
10 |
30 |
40 minutes |
6.7 |
|
10a |
Year 2020 – Stage 2A |
30 |
30 |
60 minutes |
5.5 |
5.92 Based on data from the bench-scale chlorination studies, the maximum chlorine residuals at the ADF stage and Stage 2A would be in the range of 4.8 - 6.3 mg/l and 4.3 – 5.3 mg/l respectively. The ranges identified from the bench-scale studies are based on the chlorine dosage of 15 and 20 mg/l. The chorine residuals assumed for the emergency scenarios as shown in Table 5.23 are 6.7 and 5.5 mg/l for ADF and Stage 2A respectively which are slightly higher than the ranges identified from the bench-scale studies. Based on the updated design information, the operational chlorine dosage would range from 11 to 15 mg/l to achieve geometric mean E.coli standard of 200,000 no. per 100ml for ADF and 10 to 14 mg/l to achieve the geometric mean standard of 20,000 no. per 100 ml for Stage 2A as shown in Table 5.18. The TRC at the dechlorination point of SCISTW will be controlled within range of 1 to 4 mg/l during the operation. The maximum chlorine dosage of 20 mg/l adopted in the bench-scale studies and the chlorine residuals adopted under the emergency scenarios are therefore conservative assumptions.
Coastline Configurations
5.93 The coastline configurations adopted for the 2009 and 2013 scenarios are shown in Figure 5.4 and Figure 5.5 respectively. The assumed coastline configurations for 2020 and ultimate stage are shown in Figure 5.6. The reclamations for South East Kowloon Development (SEKD), Wan Chai Development II (WDII) and Yau Tong Bay Reclamation (YTBR) were excluded as they were still subject to planning review when this EIA report was prepared. It should be noted that the reclamation for Central Reclamation Phase III (CRIII) has been incorporated into the existing coastline as shown in Figure 5.4 to Figure 5.6.
5.94 Sensitivity test was conducted under this Study to investigate the effect of possible changes of coastline configurations in Victoria Harbour on the overall conclusion of the water quality impact assessment. Additional sensitivity test modelling was undertaken for 2020 using an alternative coastline configuration for the Victoria Harbour as shown in Figure 5.7, namely Scenario 3f. The alternative coastline configurations have incorporated the reclamations for SEKD, WDII and YBTR. The reclamation limits for these additional developments as shown in Figure 5.7 are based on the information provided in the latest approved EIA reports for these developments. Scenario 3e uses the maximum extent of reclamation as in previous approved EIA which already represents the worst case impact upon the hydrodynamic and water quality, as compared to the base case scenario (namely Scenario 3b) with no reclamation at all within the Victoria Harbour. Additional model runs to consider the latest concept plans for SEKD and WDII which involve a lesser extent of reclamation are considered not necessary.
Pollution Loading
5.95 The pollution loading inventory for different assessment years was compiled using the latest planning data. Appendix 5-2 gives the detailed methodology for compiling the pollution loading. The inventory has incorporated all possible pollution sources within the Hong Kong waters including those from landfill sites, non-point source surface run-off and sewage from cross connections etc. The inventory has also taken into account the removal of pollutants due to wastewater treatment facilities and the possible redistribution of pollution loads due to different sewage disposal plans and sewage export schemes.
5.96 The key sewage effluent discharges included in the far field water quality model for cumulative assessment include the effluent flow from SCISTW, Pillar Point STW, Siu Ho Wan STW, NWNT outfall, Sham Tseng STW and THEES. Figure 5.8 shows the major sewage outfalls located in the assessment area. The pollution loading inventory for these major sewage outfalls was considered separately based on the information from recent studies and actual measurements. Appendix 5-4 gives the flow and effluent concentrations assumed for these major sewage outfalls under different assessment scenarios.
5.97 It should be noted that the water quality at the Tsuen Wan Coast including the eight beaches in Tsuen Wan District was greatly influenced by the local pollution sources as discussed in Section 5.44. The future pollution loads from these background sources were estimated using the best information available at the time when this EIA report was prepared, and were included in the water quality model for cumulative impact assessment. Based on the information obtained from DSD and EPD under this EIA, it is expected that the sewerage along the Castle Peak Road would be in place around the same time of commissioning of this ADF Project to serve unsewered villages and properties around Ting Kau, Sham Tseng and Tsing Lung Tau. For the purpose of water quality modelling, it is assumed that the residual loading discharged to the Tsuen Wan coast from Sham Tseng, Tsuen Wan, Kwai Chung and Tsing Yi catchments in the future would be 10 percent of the total loading generated within these catchments which is a conservative assumption. To enhance the model configuration, distribution of the pollution loading of the beach hinterlands is adjusted based on the updated information on the distribution of unsewered population in the respective areas.
Identification of Environmental Impacts
Construction Phase
General Construction Activities
5.98 The general construction activities would be primarily land-based as descried in Section 2.11. Various types of construction activities may generate wastewater. These include general cleaning and polishing, wheel washing, dust suppression and utility installation. These types of wastewater would contain high concentrations of suspended solids. Impacts could also result from the accumulation of solid and liquid waste such as packaging and construction materials, and sewage effluent from the construction work force involved with the construction. If uncontrolled, these could lead to deterioration in water quality.
Construction Site Runoff
5.99 During a rainstorm, site runoff would wash away the soil particles. The runoff is generally characterised by high concentrations of suspended solids. Uncontrolled release of site runoff would increase the SS levels and turbidity in the nearby water environment.
5.100 Increase in debris and SS arising from the construction site could also block the drainage channels and may result in local flooding when heavy rainfall occurs. High concentrations of suspended degradable organic material in marine water could lead to reduction in DO levels in the water column.
5.101 Wind blown dust would be generated from exposed soil surface in the works areas. It is possible that wind blown dust would fall directly onto the nearby water bodies when a strong wind occurs. Dispersion of dust within the works areas may increase the SS levels in surface runoff causing a potential impact to the nearby sensitive receivers.
Accidental Spillage
5.102 A large variety of chemicals would be used during construction. These may include surplus adhesives, spent paints, petroleum products, lubrication oil, grease and mineral oil, spent acid and alkaline solutions/solvent and other chemicals. Accidental spillage of chemicals in the works areas may contaminate the surface soils. The contaminated soil particles may be washed away by construction site runoff or storm runoff causing water pollution.
Operation Phase
5.103 The Project involves the provision of disinfection facilities at the existing SCISTW. The key operational phase water quality effects from this Project would be:
· the reduction of faecal bacteria in the effluent due to the proposed disinfection facilities
· the potential generation of low-level TRC and CBP in the effluent due to chlorination of the sewage effluent
· the potential impact of TRC in the event of dechlorination plant failure
· the potential impact of faecal pollution in the event of chlorination plant failure
· the potential minor oxygen depletion impact due to addition of dechlorination chemical
Prediction and Evaluation of Environmental Impacts
Construction Phase
5.104 The Project would involve the following major construction activities:
· Site formation & site establishment
· Piling (presumably pre-bored H pile)
· Excavation and backfilling
· Erection of formwork and reinforcement
· Concreting
· Fabrication of steelwork & installation of E&M equipment
· Testing and commissioning
General Construction Activities
5.105 The effects on water quality from general construction activities are likely to be minimal, provided that site drainage would be well maintained and good construction practices would be observed to ensure that litter, fuels, and solvents are managed, stored and handled properly.
5.106 Based on the Sewerage Manual, Part I, 1995 of the Drainage Services Department (DSD), the sewage production rate for construction workers is estimated at 0.35 m3 per worker per day. For every 50 construction workers working simultaneously at the construction site, about 17.5 m3 of sewage would be generated per day. The sewage should not be allowed to discharge directly into the surrounding water body without treatment. Sufficient chemical toilets should be provided for workers. Existing toilets within the SCISTW could also be made available for use as necessary.
Construction Runoff and Drainage
5.107 Construction run-off and drainage may cause local water quality impacts. It is important that proper site practice and good site management be followed to prevent run-off with high level of SS from entering the surrounding waters. With the implementation of appropriate measures to control run-off and drainage from the construction site, disturbance of water bodies would be avoided and deterioration in water quality would be minimal. Thus, unacceptable impacts on the water quality are not expected, provided that the recommended measures described in Sections 5.212 to 5.220 are properly implemented.
Operation Phase
Normal Operation
Overall E.coli Impact
5.108 The contour plots of predicted depth-averaged E.coli for the whole Study Area are compared between different assessment scenarios in Figure 5.9 and Figure 5.10 for wet and dry seasons respectively. Figure 5.11 and Figure 5.12 show the close up of the model output at Western Buffer WCZ and its adjacent waters. Appendix 5-5 to Appendix 5-8 tabulate the E.coli levels predicted at the bathing beaches, WSD flushing water intakes, fish culture zones (FCZ) and other ecological sensitive receivers identified within the Study Area. The results provided in Appendix 5-5 to Appendix 5-8 are depth-averaged results except for the seawater intakes where the results are presented for the mid-depth where the intake points are located.
5.109 To isolate the impact of the SCISTW effluent from other background discharges assumed in the model, additional model runs were performed by including the SCISTW effluent only for the four assessment years (i.e. 2009, 2013, 2020 and ultimate scenarios). The results of these additional model runs showing the effluent plume from SCISTW alone are presented as contour plots in Figure 5.13 and Figure 5.14 for wet and dry seasons respectively. The E.coli improvements due to the proposed disinfection are also presented in Figure 5.13 and Figure 5.14 for reference.
5.110 The contour plots indicated that the baseline water quality impact on Tsuen Wan and Tuen Mun waters would be smaller in 2013 (Scenario 2a) as compared to 2009 (Scenario 1a) which was mainly caused by the upgrading of Pillar Point STW which was scheduled to be implemented in 2011. It can also be seen that the water quality in Victoria Harbour and areas to the southwest of Hong Kong Island would be improved after the implementation of HATS Stage 2A under Scenario 3a. The HATS Stage 2A is scheduled for implementation in 2014 and the observed improvement in water quality would be seen thereafter. However, the degree of local impact in areas close to the SCISTW outfall would be larger after implementation of HATS Stage 2A in 2014 (Figure 5.9 and Figure 5.10).
5.111 The comparison between the modelling results of baseline scenarios (without disinfection at SCISTW) and operation phase scenario (with disinfection at SCISTW) indicated that the provision of disinfection at SCISTW would significantly improve the water quality in Victoria Harbour and Western Buffer WCZ. The model results showed that there was no obvious difference in the extent of water quality impact between the two scenarios in areas farther away such as Junk Bay WCZ, Eastern Buffer WCZ and Southern WCZ.
5.112 The model prediction also showed that the influence from the SCISTW effluent would be relatively smaller along the eastern coast of Tsuen Wan inside the Rambler Channel as compared to the western coast of Tsuen Wan. The SCISTW outfall is situated to the south of Tsuen Wan coast where the SCISTW effluent would be brought to the Tsuen Wan coast by the water current flowing from south to north during flood tides. Figure 5.15 shows the flow patterns in the Western Buffer WCZ under typical flood and ebb tide conditions. Under the flood tide conditions, the SCISTW effluent flowing towards the Tsuen Wan coast would be blocked by the Tsing Yi Island and diverted around the Tsing Yi Island to the western coast of Tsuen Wan. Therefore, the eastern coast of Tsuen Wan inside the Rambler channel would be subject to a lesser extent of the influence from SCISTW effluent.
5.113 In ultimate year, the degree of E.coli improvement by disinfection would be substantially reduced due to the fact that the E.coli levels would be substantially lower from the secondary process under Stage 2B even without the provision of disinfection. However, there would still be water quality improvements in areas to the south of Tsing Yi Island in the central Western Buffer WCZ and western Victoria Harbour (Figure 5.13 and Figure 5.14).
5.114 Water quality objectives (WQO) for E.coli are available for the secondary contact subzones, fish culture zones (FCZ), WSD flushing water intakes and bathing beaches. Figure 5.1 shows the boundaries of the secondary contact subzones as well as the locations of FCZ, WSD intakes and beaches identified within the Study Area.
5.115 As shown in Appendix 5-5 to Appendix 5-8, the geometric mean E.coli levels predicted at all the identified FCZ would comply with the WQO of 610 no. per 100 ml under all the baseline and assessment scenarios (i.e. both with and without disinfection). Impacts on the identified ecological receivers are addressed in detail under the ecological impact assessment in Section 7.
5.116 Appendix 5-5 to Appendix 5-8 show that the provision of disinfection facilities at SCISTW would significantly improve the situation (i.e. reduce the degree of WQO exceedances) at the Tsuen Wan beaches during the ADF Stage and Stage 2A. The influence zone of the HATS effluent would not cover the area in farther field including the beaches in Tuen Mun, Lantau Island, southern Hong Kong Island and Cheung Chau.
5.117 With the provision of disinfection facilities at SCISTW, full compliance with the WSD standard of 20000 no. per 100 ml would be achieved at all the identified flushing water intakes within the Study Area except that the maximum values predicted for the intakes at North Point and Sheung Wan (during ADF Stage) and Cheung Sha Wan (during ADF stage, Stage 2A and Stage 2B) would exceed the WQO as shown in Appendix 5-5 to Appendix 5-8. The residual exceedances predicted at North Point during ADF stage were essentially due to the pollutants discharged from the nearby North Point PTW before the implementation of HATS Stage 2A. These exceedances were shown to cease after the implementation of HATS Stage 2A when effluent from North Point PTW would be intercepted to the SCISTW by the HATS Stage 2A sewage conveyance system. The residual exceedances at Cheung Sha Wan were caused by the pollutants discharged from the nearby storm drains as the same levels of exceedances were predicted under both baseline (with no disinfection at SCISTW) and operational phase (with disinfection at SCISTW). It is therefore considered that the residual exceedances predicted at North Point and Cheung Sha Wan (after the Project commissioned) are not related to the effluent discharged from SCISTW. It is expected that the residual exceedances predicted at Sheung Wan (located in the western Victoria Harbour) during ADF stage was caused by the sewage discharged from the nearby Central PTW. As indicated in Appendix 5-5 to Appendix 5-7, the provision of disinfection at the SCISTW would improve the WQO compliances at the WSD flushing water intakes located in the western Victoria Harbour, namely Central Water Front, Sheung Wan and Kennedy Town, under ADF stage and Stage 2A.
5.118 Non-compliance with the WQO (of 610 no. per 100 ml for geometric mean) was predicted within the secondary contact subzones in the coastal areas of Tuen Mun and Tsuen Wan as shown in Figure 5.9 and Figure 5.10. It was found that the degree of exceedances in the Tuen Mun and Tsuen Wan coast would be improved after the provision of disinfection facilities at the SCISTW during ADF stage and Stage 2A.
5.119 Non-compliance with the WQO was also predicted at some of the secondary contact subzones outside the Tuen Mun and Tsuen Wan Districts. These exceedances were however not related to the HATS discharge as the same levels of exceedances were predicted under the baseline scenarios (without disinfection at SCISTW) and the operational phase scenarios (with disinfection at SCISTW). These exceedances were due to the discharges from the local sources assumed in the modelling for the purpose of cumulative assessment.
5.120 Based on the water quality modelling results, it was found that the undisinfected effluent from SCISTW would contribute WQO exceedances at the WSD flushing water intakes in western Victoria Harbour, the beaches in Tsuen Wan District as well as the secondary contact subzones in Tsuen Mun and Tsuen Wan coast. Thus, more detailed analysis on these potential impacts was conducted to determine the optimum disinfection level for protecting the beneficial uses of these sensitive receivers. Detailed analysis of these potential impacts is provided in subsequent sections.
Impacts on Water Sensitive Receivers
5.121 Three WSD flushing water intakes in western Victoria Harbour, namely Central Water Front (WSD18), Sheung Wan (WSD19) and Kennedy Town (WSD20) respectively would be affected by the HATS effluent. Figure 5.1 shows the locations of these flushing water intakes. Appendix 5-5 to Appendix 5-8 tabulate the geometric mean and maximum E.coli levels predicted at the WSD flushing water intakes for both the operational scenarios (with disinfection at SCISTW) and the baseline scenarios (without disinfection at SCISTW).
5.122 There are eight beaches in Tsuen Wan District, namely Anglers’ (B7), Gemini (B8), Ho Mei Wan (B9), Casam (B10), Lido (B11), Ting Kau (B12), Approach (B13) and Ma Wan (B14) respectively, which would be affected by the HATS effluent. Figure 5.3 shows the locations of these Tsuen Wan beaches. Figure 5.16 and Figure 5.17 show the predicted E.coli levels at the Tsuen Wan beaches. Results for both the operational scenarios (with disinfection at SCISTW) and the baseline scenarios (without disinfection at SCISTW) are included in Figure 5.16 and Figure 5.17 for comparison. The geometric mean and maximum values predicted at the beaches are also tabulated in Appendix 5-5 to Appendix 5-8. To isolate the impact of the SCISTW effluent from other background discharges assumed in the model, additional model runs were performed by including the SCISTW effluent only for the four assessment years. These additional model runs aimed to provide an indication of the impact contributed from the SCISTW effluent alone at the water sensitive receivers.
5.123 Model results provided for flushing water intakes represent the E.coli values predicted at the mid-depth where the intake points are located. These model results are compared with the WSD standard (≤ 20000 no. per 100 ml at all times) to evaluate the potential impacts upon the flushing water intakes. The impact assessment on the bathing beaches was made based on depth-averaged E.coli results because the WQO (≤ 180 no. per 100 ml, geometric mean for bathing season) is applicable to the whole bathing water body. As the water depth at the bathing beaches is considered small, it is not expected that there would be any significant difference in the depth averaged and the surface E.coli levels.
5.124 The bathing (or wet) season is defined as the period from March to October based on the WQO set out under the WPCO. Thus, November to February would represent the dry season. The model simulation was however performed for a 30-day period under typical wet season condition covering the period from late July to late August and typical dry season condition covering the period from late January to late February. As the meteorological forcing, wind condition, daily pollution load discharges and all process coefficients adopted in the water quality model set-up are constant throughout the simulations and each model simulation covered at least a full tidal cycle (including both large amplitude spring tides and small amplitude neap tides) in wet season, it is considered acceptable to compare the mean model output from the 30-day simulations with the WQO to evaluate the beach water quality impacts. Moreover, the model simulations were separately performed for the dry season (non-bathing season) scenarios. The dry season model results are also compared with the beach WQO under this EIA to assess the potential water quality impacts in the non-bathing seasons for reference. It should however be noted that there is no statutory requirement on the beach water quality during the non-bathing seasons in Hong Kong.
Bathing Beaches
5.125 Major factors that influencing the predicted E.coli levels at Tsuen Wan beaches include:
· Change of HATS effluent loading
· Change of local pollution loading from the polluted storm water discharged from the rural areas of Sham Tseng and the dense urban areas in Tsuen Wan, Kwai Chung and Tsing Yi Districts
· Upgrading the treatment process of Pillar Point STW from preliminary treatment to CEPT plus disinfection which is scheduled for commissioning by 2011/12.
2009 (Early HATS ADF Stage)
5.126 Table 5.24 and Table 5.25 show the E.coli levels predicted at the beaches in 2009 during early commissioning of the Project for wet season and dry season respectively. Figure 5.16 and Figure 5.17 present the results graphically as contour plots. The E.coli levels predicted at the beaches in Table 5.24 and Table 5.25 are broken down by two different components (namely the SCISTW effluent alone and other background discharges respectively).
5.127 It should be highlighted that it is not possible to isolate the impact of the SCISTW discharge mathematically as the E.coli levels are reported as geometric mean. The HATS contributions shown in the tables below only represent an indication of the impact from SCISTW discharge alone. To isolate the impact of the SCISTW effluent from other background discharges assumed in the model, sensitivity model runs were performed by including the SCISTW effluent only. The background contributions shown in tables below were estimated by subtracting the geometric mean level predicted under the sensitivity run from the geometric mean levels resulted from the base case scenarios with both the SCISTW and background discharges.
|
Pollution Source
|
Anglers' |
Gemini |
Hoi Mei Wan |
Casam |
Lido |
Ting Kau |
Approach |
Ma Wan |
|
Geometric Mean * (no. per 100 ml) |
||||||||
|
WQO: |
180 |
|||||||
|
Scenario 1a – without disinfection at SCISTW (base case scenario using an effluent E.coli value of 1E+7 per 100 ml) |
||||||||
|
SCISTW effluent (w/o disinfection) |
683 |
761 |
733 |
221 |
194 |
145 |
295 |
486 |
|
Other background sources ** |
259 |
283 |
191 |
304 |
282 |
313 |
238 |
130 |
|
Total |
942 |
1044 |
924 |
525 |
476 |
458 |
533 |
616 |
|
Scenario 1b – with disinfection at SCISTW (base case scenario using an effluent E.coli value of 2E+5 per 100 ml) |
||||||||
|
SCISTW effluent (with disinfection) |
14 |
15 |
15 |
4 |
4 |
3 |
6 |
10 |
|
Other background sources ** |
259 |
283 |
191 |
304 |
282 |
313 |
238 |
130 |
|
Total |
273 |
298 |
206 |
308 |
286 |
316 |
244 |
140 |
Shaded cell – exceedance of beach water quality objective.
The model results are subject to uncertainties and limitations as discussed in Appendix 5.2a.
** The major background sources are described in Section 5.129.
|
Pollution Source
|
Anglers' |
Gemini |
Hoi Mei Wan |
Casam |
Lido |
Ting Kau |
Approach |
Ma Wan |
|
Geometric Mean * (no. per 100 ml) |
||||||||
|
WQO: |
180 |
|||||||
|
Scenario 1a – without disinfection at SCISTW (base case scenario using an effluent E.coli value of 1E+7 per 100 ml) |
||||||||
|
SCISTW effluent (w/o disinfection) |
476 |
539 |
547 |
168 |
164 |
112 |
150 |
204 |
|
Other background sources ** |
152 |
147 |
114 |
122 |
103 |
194 |
439 |
17 |
|
Total |
628 |
686 |
661 |
290 |
267 |
306 |
589 |
221 |
|
Scenario 1b – with disinfection at SCISTW (base case scenario using an effluent E.coli value of 2E+5 per 100 ml) |
||||||||
|
SCISTW effluent (with disinfection) |
10 |
11 |
11 |
3 |
3 |
2 |
3 |
4 |
|
Other background sources ** |
152 |
147 |
114 |
122 |
103 |
194 |
439 |
17 |
|
Total |
162 |
158 |
125 |
125 |
106 |
196 |
442 |
21 |
Shaded cell – exceedance of beach water quality objective.
The model results are subject to uncertainties and limitations as discussed in Appendix 5.2a.
** The major background sources are described in Section 5.129.
5.128 The predicted E.coli levels would exceed the WQO at all the Tsuen Wan beaches in 2009 under the baseline scenarios (i.e. without disinfection at SCISTW). The model results however showed that provision of disinfection at SCISTW (with the proposed geometric mean effluent E.coli standard of 200,000 no. per 100 ml) would significantly reduce the E.coli levels at Tsuen Wan beaches (with the HATS contribution almost eliminated). Except for Ma Wan Beach, the quality of these beaches may still be affected by the local discharges unrelated to HATS.
5.129 The beach water quality after ADF commissioning at 2009 is predicted to be impacted partly by:
· Rural areas of Sham Tseng
· Polluted waters in Rambler Channel due to the expedient connections, misconnections and surface runoff from the dense urban areas in Tsuen Wan, Kwai Chung and Tsing Yi Districts
· Discharges from other sewage and storm outfalls within the modelled areas
5.130 Table 5.24 and Table 5.25 also indicated that, without the provision of disinfection facilities at SCISTW, the E.coli impacts from the SCISTW effluent would be significant, which demonstrated the need of disinfection to improve the beach water quality. With the provision of disinfection at SCISTW, the E.coli contributions from SCISTW would be substantially reduced. The mean E.coli levels contributed by the disinfected effluent from SCISTW alone as predicted by the model were less than 20 no. per 100 ml.
2013 (Late HATS ADF Stage)
5.131 Table 5.26 and Table 5.27 show the E.coli results for year 2013 at the late ADF stage before commissioning of HATS Stage 2A. Similar to the 2009 case, the model predicted that the provision of disinfection at SCISTW at late ADF stage (with the proposed geometric mean effluent E.coli standard of 200,000 no. per 100 ml) would significantly reduce the E.coli levels at the beaches. It was found that the E.coli impacts from the background sources were improved by 2013 as compared to the 2009 case. This was caused by the local improvement works as well as the upgrading of PPSTW, which is scheduled for commissioning in 2011/12. It was predicted that the beach water quality would comply with the WQO in 2013 at all the beaches, except the Approach Beach in dry season, with the provision of disinfection facilities at SCISTW. The contributions from the disinfected effluent from SCISTW ranged from 2 to 12 E.coli per 100 ml only. The residual impact predicted at the beaches was caused by other background pollution sources as mentioned in Section 5.129.
|
Pollution Source
|
Anglers' |
Gemini |
Hoi Mei Wan |
Casam |
Lido |
Ting Kau |
Approach |
Ma Wan |
|
Geometric Mean * (no. per 100 ml) |
||||||||
|
WQO: |
180 |
|||||||
|
Scenario 2a – without disinfection at SCISTW (base case scenario using an effluent E.coli value of 1E+7 per 100 ml) |
||||||||
|
SCISTW effluent (w/o disinfection) |
525 |
591 |
565 |
144 |
125 |
88 |
203 |
336 |
|
Other background sources ** |
97 |
137 |
73 |
147 |
118 |
159 |
90 |
52 |
|
Total |
622 |
728 |
638 |
291 |
243 |
247 |
293 |
388 |
|
Scenario 2b – with disinfection at SCISTW (base case scenario using an effluent E.coli value of 2E+5 per 100 ml) |
||||||||
|
SCISTW effluent (with disinfection) |
11 |
12 |
11 |
3 |
3 |
2 |
4 |
7 |
|
Other background sources ** |
97 |
137 |
73 |
147 |
118 |
159 |
90 |
52 |
|
Total |
108 |
149 |
84 |
150 |
121 |
161 |
94 |
59 |
Shaded cell – exceedance of beach water quality objective.
The model results are subject to uncertainties and limitations as discussed in Appendix 5.2a.
** The major background sources are described in Section 5.129.
|
Pollution Source
|
Anglers' |
Gemini |
Hoi Mei Wan |
Casam |
Lido |
Ting Kau |
Approach |
Ma Wan |
|
Geometric Mean * (no. per 100 ml) |
||||||||
|
WQO: |
180 |
|||||||
|
Scenario 2a – without disinfection at SCISTW (base case scenario using an effluent E.coli value of 1E+7 per 100 ml) |
||||||||
|
SCISTW effluent (w/o disinfection) |
432 |
491 |
496 |
144 |
140 |
94 |
127 |
180 |
|
Other background sources ** |
101 |
103 |
78 |
99 |
76 |
167 |
360 |
9 |
|
Total |
533 |
594 |
574 |
243 |
216 |
261 |
487 |
189 |
|
Scenario 2b – with disinfection at SCISTW (base case scenario using an effluent E.coli value of 2E+5 per 100 ml) |
||||||||
|
SCISTW effluent (with disinfection) |
9 |
10 |
10 |
3 |
3 |
2 |
3 |
4 |
|
Other background sources ** |
101 |
103 |
78 |
99 |
76 |
167 |
360 |
9 |
|
Total |
110 |
113 |
88 |
102 |
79 |
169 |
363 |
13 |
Shaded cell – exceedance of beach water quality objective.
The model results are subject to uncertainties and limitations as discussed in Appendix 5.2a.
** The major background sources are described in Section 5.129.
2020 (Late Phase of HATS Stage 2A)
5.132 Table 5.28 and Table 5.29 show the E.coli results for year 2020 at late phase of HATS Stage 2A. With disinfection at SCISTW, the E.coli levels predicted at the beaches would be significantly reduced. Table 5.28 and Table 5.29 show that the absolute contribution from the undisinfected effluent of SCISTW in Stage 2A was larger than that in ADF stage (2009 and 2013). This was due to the fact that more sewage flow would be intercepted to the SCISTW under HATS Stage 2A and hence the effluent E.coli loading in the undisinfected effluent would be increased. The absolute contribution from the disinfected effluent of SCISTW during the late phase of HATS Stage 2A was smaller than that in ADF stage, as the proposed disinfection level for Stage 2A (with a geometric mean effluent E.coli standard of 20,000 no. per 100 ml) was higher than that for ADF stage (with a geometric mean effluent E.coli standard of 20,000 no. per 100 ml). At the ADF stage, the existing effluent culvert system would be used for chlorine contact whilst at Stage 2A, a new chlorine contact tank would be built for the HATS effluent to enhance the disinfection performance. Although the recommended dosage for ADF stage would be the similar as that for Stage 2A, the resulted disinfection level for Stage 2A would be higher than that for ADF stage due to the longer contact time available under the Stage 2A.
|
Pollution Source
|
Anglers' |
Gemini |
Hoi Mei Wan |
Casam |
Lido |
Ting Kau |
Approach |
Ma Wan |
|
Geometric Mean * (no. per 100 ml) |
||||||||
|
WQO: |
180 |
|||||||
|
Scenario 3a – without disinfection at SCISTW (base case scenario using an effluent E.coli value of 1E+7 per 100 ml) |
||||||||
|
SCISTW effluent (w/o disinfection) |
727 |
817 |
778 |
199 |
171 |
122 |
280 |
479 |
|
Other background sources ** |
72 |
86 |
45 |
149 |
116 |
166 |
80 |
38 |
|
Total |
799 |
903 |
823 |
348 |
287 |
288 |
360 |
517 |
|
Scenario 3b – with disinfection at SCISTW (base case scenario using an effluent E.coli value of 2E+4 per 100 ml) |
||||||||
|
SCISTW effluent (with disinfection) |
2 |
2 |
2 |
1 |
1 |
1 |
1 |
1 |
|
Other background sources ** |
72 |
86 |
45 |
149 |
116 |
166 |
80 |
38 |
|
Total |
74 |
88 |
47 |
150 |
117 |
167 |
81 |
39 |
Shaded cell – exceedance of beach water quality objective.
The model results are subject to uncertainties and limitations as discussed in Appendix 5.2a.
** The major background sources are described in Section 5.129.
|
Pollution Source
|
Anglers' |
Gemini |
Hoi Mei Wan |
Casam |
Lido |
Ting Kau |
Approach |
Ma Wan |
|
Geometric Mean * (no. per 100 ml) |
||||||||
|
WQO: |
180 |
|||||||
|
Scenario 3a – without disinfection at SCISTW (base case scenario using an effluent E.coli value of 1E+7 per 100 ml) |
||||||||
|
SCISTW effluent (w/o disinfection) |
611 |
693 |
694 |
202 |
197 |
131 |
179 |
271 |
|
Other background sources ** |
80 |
69 |
56 |
97 |
70 |
171 |
343 |
3 |
|
Total |
691 |
762 |
750 |
299 |
267 |
302 |
522 |
274 |
|
Scenario 3b – with disinfection at SCISTW (base case scenario using an effluent E.coli value of 2E+4 per 100 ml) |
||||||||
|
SCISTW effluent (with disinfection) |
2 |
2 |
2 |
1 |
1 |
1 |
1 |
1 |
|
Other background sources ** |
80 |
69 |
56 |
97 |
70 |
171 |
343 |
3 |
|
Total |
82 |
71 |
58 |
98 |
71 |
172 |
344 |
4 |
Shaded cell – exceedance of beach water quality objective.
The model results are subject to uncertainties and limitations as discussed in Appendix 5.2a.
** The major background sources are described in Section 5.129.
5.133 It was predicted that the beach water quality would comply with the WQO during Stage 2A at all the beaches, except the Approach Beach in dry season, with the provision of disinfection facilities at SCISTW. The contribution from the disinfected effluent from SCISTW was negligible under Stage 2A (ranged from 1 to 2 E.coli per 100 ml only). The residual impact predicted by the model was caused by other background pollution sources.
Ultimate Year (Late Phase of HATS Stage 2B)
5.134 Table 5.30 and Table 5.31 show that similar to the HATS Stage 2A case, the contribution from the disinfected effluent from SCISTW was negligible in the ultimate year under Scenario 4b. The residual impacts predicted by the model were caused by other background pollution sources.
5.135 The model results showed that the contribution from the undisinfected effluent from HATS Stage 2B under Scenario 4a (with an effluent E.coli value of 2.96E+5 no. per 100 ml) would be significantly greater than the case with disinfection at SCISTW. The HATS contributions ranged from 4 to 24 no. per 100 ml which however did not contribute any new WQO exceedance at the beaches. However, it is important to note that modelling cannot fully predict the high variability of some factors (e.g. salinity, natural ultra violet radiation, and wind) that affect the density of E. coli in the receiving waters. Therefore, planning for disinfection in Stage 2B is recommended, though this provision may be reviewed in the light of actual water quality monitoring results after commissioning of the ADF.
|
Pollution Source
|
Anglers' |
Gemini |
Hoi Mei Wan |
Casam |
Lido |
Ting Kau |
Approach |
Ma Wan |
|
Geometric Mean * (no. per 100 ml) |
||||||||
|
WQO: |
180 |
|||||||
|
Scenario 4a–without disinfection at SCISTW (base case scenario using an effluent E.coli value of 2.96E+5 per 100 ml) |
||||||||
|
SCISTW effluent (w/o disinfection) |
24 |
27 |
26 |
7 |
6 |
4 |
9 |
16 |
|
Other background sources ** |
84 |
99 |
51 |
183 |
140 |
204 |
92 |
38 |
|
Total |
108 |
126 |
77 |
190 |
146 |
208 |
101 |
54 |
|
Scenario 4b – with disinfection at SCISTW (base case scenario using an effluent E.coli value of 2E+4 per 100 ml) |
||||||||
|
SCISTW effluent (with disinfection) |
2 |
2 |
2 |
1 |
1 |
1 |
1 |
2 |
|
Other background sources ** |
84 |
99 |
51 |
183 |
140 |
204 |
92 |
38 |
|
Total |
86 |
101 |
53 |
184 |
141 |
205 |
93 |
40 |
Shaded cell – exceedance of beach water quality objective.
The model results are subject to uncertainties and limitations as discussed in Appendix 5.2a.
** The major background sources are described in Section 5.129.
|
Pollution Source
|
Anglers' |
Gemini |
Hoi Mei Wan |
Casam |
Lido |
Ting Kau |
Approach |
Ma Wan |
|
Geometric Mean * (no. per 100 ml) |
||||||||
|
WQO: |
180 |
|||||||
|
Scenario 4a–without disinfection at SCISTW (base case scenario using an effluent E.coli value of 2.96E+5 per 100 ml) |
||||||||
|
SCISTW effluent (w/o disinfection) |
21 |
24 |
24 |
7 |
7 |
5 |
6 |
10 |
|
Other background sources ** |
95 |
78 |
63 |
115 |
81 |
201 |
385 |
3 |
|
Total |
116 |
102 |
87 |
122 |
88 |
206 |
391 |
13 |
|
Scenario 4b – with disinfection at SCISTW (base case scenario using an effluent E.coli value of 2E+4 per 100 ml) |
||||||||
|
SCISTW effluent (with disinfection) |
2 |
2 |
2 |
1 |
1 |
1 |
1 |
1 |
|
Other background sources ** |
95 |
78 |
63 |
115 |
81 |
201 |
385 |
3 |
|
Total |
97 |
80 |
65 |
116 |
82 |
202 |
386 |
4 |
Shaded cell – exceedance of beach water quality objective.
The model results are subject to uncertainties and limitations as discussed in Appendix 5.2a.
** The major background sources are described in Section 5.129.
5.136 The high background E.coli levels predicted at Ting Kau and Casam are due to the nearby storm pollution loading assumed in the model. It is believed that the continuous efforts by the government to improve the sewerage system and implement water pollution control measures and enforcement in these catchments will eliminate the residual local water quality problems at the Ting Kau and Casam beaches in the long term.
Discussions on the Modelling Results for Bathing Beaches
5.137 The model predicted that the E.coli levels in wet seasons are in general higher than that in dry seasons at all the beaches except for Approach Beach. This could be explained by the differences in the flow regime between dry and wet seasons. In wet seasons, the coastal currents are in general from southwest to northeast and the Pearl river discharges would flow on the surface to the west which brings more HATS effluent from the south and other background sources from the east to the Tsuen Wan coast. In dry seasons, the coastal currents are generally from east to west and the Pearl river discharges flow to the southwest. Thus, during dry seasons, Approach Beach would be subject to the largest influence from the polluted marine water at the inner Rambler Channel due to the direction of coastal currents (Figure 5.17). Other beaches are however located in more embayed areas (as compared to Approach beach) and are therefore sheltered from the effect in dry seasons.
5.138 For the case “with disinfection at SCISTW” in 2013 (late ADF stage), 2020 (late phase of Stage 2A) and ultimate year (late phase of Stage 2B) as shown in Table 5.26 to Table 5.31, the differences in the model results between the dry season case and the wet season case are substantially smaller as compared to the 2009 case (early ADF stage) at Anglers’, Gemini, Hoi Mei Wan, Casam, Lido and Ting Kau. As pointed out before, these beaches should be subject to a larger impact from the HATS effluent in the south and other background sources in the east under the wet season scenarios as compared to the dry season scenarios because of the coastal currents. These pollution sources would be, however, mostly eliminated in 2013 (late ADF stage) due to the provision of disinfection facilities at SCISTW in 2009 and Pillar Point STW in 2011/12 which thus diminishes the potential impacts in the wet seasons.
5.139 The model results indicated that the residual E.coli levels predicted at Approach Beach would likely breach the WQO in dry season and this situation would remain the same in the ultimate year. The residual impact predicted at Approach Beach was caused by the polluted storm discharges from the Tsuen Wan, Kwai Chung and Tsing Yi Districts. To address the uncertainties on the programme for implementing sewerage improvement and water pollution control measures in the Tsuen Wan and Kwai Tsing catchments, it is assumed in this modelling exercise that 10% of the total load generated in these catchments would be lost to the marine waters and no further reduction on these storm discharges would be achieved in the future for conservative assessment. This is a worst case assumption and would provide an indication on the maximum extent of the potential water quality impacts. It is believed that the continuous efforts by the government to improve the sewerage system and implement water pollution control measures and enforcement in these catchments will eliminate the residual local water quality problems at Approach beach in the long term.
5.140 For the case “with disinfection at SCISTW” as shown in Table 5.28 to Table 5.31, the predicted impacts at the beaches are slightly worsened under the ultimate scenario as compared to the 2020 case. This was caused by the increase in the background storm loading assumed in the model due to the projected population growth between 2020 and the ultimate year given that a constant sewage interception rate of 90% was assumed for both 2020 and ultimate year.
Consideration of Lower Disinfection Level
5.141 Additional model runs were performed for 2013 (ADF stage) and 2020 (Stage 2A) using a lower disinfection level as sensitivity tests, namely Scenario 2c and Scenario 3c respectively. The objective was to determine the minimum chlorine dosage required for protecting the beneficial use of Tsuen Wan beaches and thus minimizing the potential generation of CBP. The ultimate scenario (Stage 2B) was not tested because the differences in the HATS contributions at the beaches were small between the Stage 2A case and the Stage 2B case under the “with disinfection” scenario (see Table 5.28 to Table 5.31). The sensitivity test results for Stage 2A, namely Scenario 3c, would be used as reference for determining the optimum effluent standard for Stage 2B. An E.coli level of 2,000,000 no. per 100 ml and 200,000 no. per 100 ml was assumed under Scenario 2c and Scenario 3c respectively. Table 5.32 to Table 5.35 show the results of these sensitivity tests. Figure 5.20 and Figure 5.21 show the contour plots for these sensitivity tests. The model results for the case using the original disinfection level (Scenario 2b and Scenario 3b) are also included in Table 5.32 - Table 5.35 and Figure 5.20 – Figure 5.21 for comparison.
|
Pollution Source
|
Anglers' |
Gemini |
Hoi Mei Wan |
Casam |
Lido |
Ting Kau |
Approach |
Ma Wan |
|
Geometric Mean * (no. per 100 ml) |
||||||||
|
WQO: |
180 |
|||||||
|
Scenario 2c – with disinfection at SCISTW (effluent E.coli level: 2,000,000 per 100 ml) |
||||||||
|
SCISTW effluent (w/o disinfection) |
95 |
129 |
102 |
25 |
22 |
15 |
35 |
59 |
|
Other background sources ** |
97 |
137 |
73 |
147 |
118 |
159 |
90 |
52 |
|
Total |
192 |
266 |
175 |
172 |
140 |
174 |
125 |
111 |
|
Scenario 2b – with disinfection at SCISTW (effluent E.coli level: 200,000 per 100 ml) |
||||||||
|
SCISTW effluent (with disinfection) |
11 |
12 |
11 |
3 |
3 |
2 |
4 |
7 |
|
Other background sources ** |
97 |
137 |
73 |
147 |
118 |
159 |
90 |
52 |
|
Total |
108 |
149 |
84 |
150 |
121 |
161 |
94 |
59 |
Shaded cell – exceedance of beach water quality objective.
The model results are subject to uncertainties and limitations as discussed in Appendix 5.2a.
** The major background sources are described in Section 5.129.
|
Pollution Source
|
Anglers' |
Gemini |
Hoi Mei Wan |
Casam |
Lido |
Ting Kau |
Approach |
Ma Wan |
|
Geometric Mean * (no. per 100 ml) |
||||||||
|
WQO: |
180 |
|||||||
|
Scenario 2c – with disinfection at SCISTW (effluent E.coli level: 2,000,000 per 100 ml) |
||||||||
|
SCISTW effluent (w/o disinfection) |
103 |
133 |
112 |
36 |
34 |
24 |
72 |
37 |
|
Other background sources ** |
101 |
103 |
78 |
99 |
76 |
167 |
360 |
9 |
|
Total |
204 |
236 |
190 |
135 |
110 |
191 |
432 |
46 |
|
Scenario 2b – with disinfection at SCISTW (effluent E.coli level: 200,000 per 100 ml) |
||||||||
|
SCISTW effluent (with disinfection) |
9 |
10 |
10 |
3 |
3 |
2 |
3 |
4 |
|
Other background sources ** |
101 |
103 |
78 |
99 |
76 |
167 |
360 |
9 |
|
Total |
110 |
113 |
88 |
102 |
79 |
169 |
363 |
13 |
Shaded cell – exceedance of beach water quality objective.
The model results are subject to uncertainties and limitations as discussed in Appendix 5.2a.
** The major background sources are described in Section 5.129.
|
Pollution Source
|
Anglers' |
Gemini |
Hoi Mei Wan |
Casam |
Lido |
Ting Kau |
Approach |
Ma Wan |
|
Geometric Mean * (no. per 100 ml) |
||||||||
|
WQO: |
180 |
|||||||
|
Scenario 3c – with disinfection at SCISTW (effluent E.coli level: 200,000 per 100 ml) |
||||||||
|
SCISTW effluent (w/o disinfection) |
16 |
31 |
17 |
5 |
4 |
3 |
6 |
10 |
|
Other background sources ** |
72 |
86 |
45 |
149 |
116 |
166 |
80 |
38 |
|
Total |
88 |
117 |
62 |
154 |
120 |
169 |
86 |
48 |
|
Scenario 3b – with disinfection at SCISTW (effluent E.coli level: 20,000 per 100 ml) |
||||||||
|
SCISTW effluent (with disinfection) |
2 |
2 |
2 |
1 |
1 |
1 |
1 |
1 |
|
Other background sources ** |
72 |
86 |
45 |
149 |
116 |
166 |
80 |
38 |
|
Total |
74 |
88 |
47 |
150 |
117 |
167 |
81 |
39 |
The model results are subject to uncertainties and limitations as discussed in Appendix 5.2a.
** The major background sources are described in Section 5.129.
Table 5.35 Predicted Geometric Mean E.coli Levels at Tsuen Wan Beaches for 2020 – Sensitivity Test - Dry (or Non-bathing) Season
|
Pollution Source
|
Anglers' |
Gemini |
Hoi Mei Wan |
Casam |
Lido |
Ting Kau |
Approach |
Ma Wan |
|
Geometric Mean * (no. per 100 ml) |
||||||||
|
WQO: |
180 |
|||||||
|
Scenario 3c – with disinfection at SCISTW (effluent E.coli level: 200,000 per 100 ml) |
||||||||
|
SCISTW effluent (w/o disinfection) |
18 |
30 |
20 |
6 |
6 |
4 |
13 |
6 |
|
Other background sources ** |
80 |
69 |
56 |
97 |
70 |
171 |
343 |
3 |
|
Total |
98 |
99 |
76 |
103 |
76 |
175 |
356 |
9 |
|
Scenario 3b – with disinfection at SCISTW (effluent E.coli level: 20,000 per 100 ml) |
||||||||
|
SCISTW effluent (with disinfection) |
2 |
2 |
2 |
1 |
1 |
1 |
1 |
1 |
|
Other background sources ** |
80 |
69 |
56 |
97 |
70 |
171 |
343 |
3 |
|
Total |
82 |
71 |
58 |
98 |
71 |
172 |
344 |
4 |
Shaded cell – exceedance of beach water quality objective.
The model results are subject to uncertainties and limitations as discussed in Appendix 5.2a.
** The major background sources are described in Section 5.129.
5.142 It should be noted that the required operational range of chlorine dosage could be reduced from 11 - 15 mg/l respectively to 10 - 14 mg/l due to the change of effluent E.coli value from 200,000 no. per 100 ml to 2,000,000 no. per 100 ml during ADF stage. The model results as shown in Table 5.32 and Table 5.33 indicated that the reduction of disinfection level during ADF stage would reduce the WQO compliances at the beaches. The contributions from SCISTW effluent predicted at the ADF stage under the sensitivity test (with an effluent E.coli value of 2,000,000 no. per 100 ml) would range from 15 up to 133 E.coli per 100 ml which at the upper end of the range is a large proportion of the WQO of 180 no. per 100 ml. The effluent E.coli levels between 200,000 no. per 100 ml to 2,000,000 no. per 100 ml were not considered further because the reduction of chlorine dosage due to such change would be insignificant.
5.143 The sensitivity test results for 2020 (Stage 2A) showed that the degree of WQO compliance would be similar between the two selected effluent E.coli levels (i.e. 20,000 no. per 100 ml and 200,000 no. per 100 ml) but the HATS contribution would increase to a level up to 31 no. per 100 ml at Gemini if the lower standard of 200,000 no. per 100 ml is used. Given the same effluent standard of 200,000 no. per 100 ml, the HATS contribution at Gemini for Stage 2A (31 no. per 100 ml) is greater than that for ADF stage (2 – 15 no. per 100 ml) because more sewage flow would be intercepted to the SCISTW under Stage 2A and hence more effluent loading would be discharged from the plant. It is considered that the operational range of chlorine dosage could be reduced from 10 - 14 mg/l to 10 - 13 mg/l due to the change of geometric mean effluent E.coli value from 20,000 no. per 100 ml to 200,000 no. per 100 ml under Stage 2A. Optimisation of the dosage would be conducted during the commissioning and operation.
Impact Summary
5.144 Water quality modelling was performed to estimate the optimum disinfection level for the proposed disinfection facilities, on one hand, to protect the health of the bathing beach users and, on the other hand, to minimize the chlorine dose and thus the generation of CBP. Modelling was also performed in a way that the impact of the HATS effluent was separated from the impact from other background pollution discharges within the Study Area.
5.145 The model results indicated that the levels of E.coli would exceed the WQO at the beaches if no disinfection is provided at SCISTW during both Stage 1 and Stage 2A. The mean E.coli levels contributed from the undisinfected HATS effluent at the beaches could range from 88 to 817 no. per 100 ml during Stage 1 and Stage 2A as compared to the WQO of 180 no. per 100 ml. The model results also indicated that provision of disinfection facilities at SCISTW would significantly improve the WQO compliances at the beaches, based on the geometric mean E.coli effluent standards of 200000 and 20000 no. per 100 ml for ADF stage and Stage 2A respectively. The mean E.coli levels contributed from the disinfected HATS effluent at the beaches would range from 2 to 15 no. per 100 ml during ADF stage and 1 to 2 no. per 100 ml during Stage 2A. These contributions were low as compared to the WQO of 180 no. per 100 ml. From this perspective, it is affirmative that provision of disinfection facilities at SCISTW could facilitate the reopening of those closed beaches at Tsuen Wan and minimize the human health risk to the current beach users.
5.146 Sensitivity tests were carried out to investigate the water quality impacts due to the reduction of effluent E.coli level from 200,000 no. per 100 ml to 2,000,000 no. per 100 ml for ADF stage. The required range of chlorine dosage could be reduced from 11 - 15 mg/l to 10 - 14 mg/l due to the change of effluent E.coli level from 200,000 no. per 100 ml to 2,000,000 no. per 100 ml. The sensitivity results showed that the reduction of disinfection level would reduce the WQO compliances at the beaches. The HATS effluent contributions at the Tsuen Wan beaches would range from 15 to 133 E.coli per 100 ml after reducing the disinfection level. At the upper end of the range, these contributions are a large proportion of the WQO of 180 no. per 100 ml. It is therefore not recommended to reduce the disinfection level from 200,000 no. per 100 ml to 2,000,000 no. per 100 ml for ADF stage. The effluent E.coli levels between 200,000 no. per 100 ml and 2,000,000 no. per 100 ml were not further considered because the reduction of chlorine dosage due to such change would be insignificant.
5.147 As pointed out in Section 5.3, at the ADF stage, the existing effluent culvert system would be used for chlorine contact and the corresponding chlorine contact times would be less than 10 minutes. Due to the short contact time, the more stringent E.coli standard of 20,000 no. per 100 ml would not be effectively achieved at the ADF stage and is therefore not further considered for sensitivity analysis. Balancing the limitations and environmental impacts during the ADF stage, the geometric mean effluent E.coli standard of 200,000 no. per 100 ml is recommended as the optimum disinfection level for the ADF, and it is confirmed by the WQ modelling that this optimum disinfection level can effectively remove the HATS contribution to the impact on the Tsuen Wan beaches.
5.148 Sensitivity tests were also carried out to investigate the water quality effect due to the reduction of effluent E.coli level from 20,000 no. per 100 ml to 200,000 no. per 100 ml for HATS Stage 2A. The required range of chlorine dosage could be reduced from 10 - 14 mg/l to 10 - 13 mg/l due to the change of effluent E.coli level from 20,000 no. per 100 ml to 200,000 no. per 100 ml. Given the same geometric mean effluent standard of 200,000 no. per 100 ml, the HATS contribution at the beaches for Stage 2A (ranged from 3 to 31 no. per 100 ml) is greater than that for ADF stage (ranged from 2 to 15 no. per 100 ml) as a result of flow build-up at HATS Stage 2A due to the collection of additional flows from northern and western areas of HK Island. Considering that the E.coli levels normally exhibit large fluctuations at the beaches based on past monitoring data (Table 5.16) and in view of the flow build-up at HATS Stage 2A, the safer standard of 20,000 no. per 100ml is recommended to minimize the human health risk to the future beach users during HATS Stage 2A. The level of 20,000 no. per 100ml is considered a reasonably safe standard to provide adequate protection for the beach users and this standard can be effectively achieved at HATS Stage 2A (without the need for excessive chlorine dosage) due to the provision of a new chlorine contact tank to increase the chlorine contact time at the SCISTW by 2014.
5.149 Based on the model result, the E.coli contribution of undisinfected effluent from HATS Stage 2B at the beaches could vary from 4 to 27 no. per 100 ml. As modelling cannot fully predict the high variability of some factors (e.g. salinity, natural ultra violet radiation, and wind) that affect the density of E. coli in the receiving waters and there is still uncertainty in the biological process to be adopted, it is therefore recommended that planning for disinfection for HATS Stage 2B should be considered to minimize the potential human health risk to future beach users and to comply with the existing Government policy of providing disinfection to all large discharges of sewage effluent and to ensure consistent compliance with the regulatory standards at sensitive receivers. The contribution from the disinfected effluent from HATS Stage 2B would be small (ranged from 1 to 2 E.coli per 100 ml only) based on the proposed effluent standard of 20,000 no. per 100 ml. Based on the same effluent standard of 20,000 no. per 100 ml, the required chlorine dosage for HATS Stage 2B (2 – 3 mg/l) would be significantly smaller than that for Stage 2A (10 - 14 mg/l) due to the substantial reduction in E.coli loading from the secondary treatment process. Based on the same considerations for Stage 2A discussed in Section 5.148, it is not recommended to adopt the lower effluent E.coli standard of 200,000 no. per 100 ml in view that the effluent flow of Stage 2B would be even larger than that for Stage 2A. The recommended effluent standard for Stage 2B would be 20,000 no. per 100 ml. A post-project monitoring should be implemented to confirm the predictions of water quality made in this EIA report at relevant stages of the HATS. The need of disinfection at Stage 2B will be subject to the prevailing environmental conditions at the time before commissioning of Stage 2B.
WSD Flushing Water Intakes
5.150 The water quality impacts upon the WSD flushing water intakes are assessed in subsequent sections based on the optimum disinfection levels recommended for protection of the Tsuen Wan beaches.
5.151 Table 5.36 and Table 5.37 tabulate the maximum E.coli levels predicted at the three WSD flushing water intakes for ADF stage (2009 and 2013) and late phase of Stage 2A (2020) assuming that the effluent E.coli value would be 200,000 no. per 100 ml (for ADF stage) and 20,000 no. per 100 ml (for Stage 2A and Stage 2B). Results for both the operational scenarios (with disinfection at SCISTW) and the baseline scenarios (without disinfection at SCISTW) for ADF stage and Stage 2A are included in Table 5.36 and Table 5.37 for comparison.
Table 5.36 Predicted Maximum E.coli Levels at WSD Flushing Water Intakes - Wet Season
|
|
2009 (ADF Stage) |
2013 (ADF Stage) |
2020 (Stage 2A) |
||||||
|
Pollution Source
|
WSD18 |
WSD19 |
WSD20 |
WSD18 |
WSD19 |
WSD20 |
WSD18 |
WSD19 |
WSD20 |
|
Maximum Level (no. per 100 ml) |
|||||||||
|
WSD Standard: |
<20000 at any time |
||||||||
|
Without disinfection at SCISTW |
|||||||||
|
SCISTW effluent (w/o disinfection) |
19653 |
23805 |
13373 |
18470 |
22528 |
13099 |
25984 |
31665 |
19090 |
|
Other background sources ** |
8412 |
22120 |
2888 |
7193 |
21298 |
2611 |
2213 |
1291 |
2522 |
|
Total |
28065 |
45925 |
16261 |
25663 |
43826 |
15710 |
28197 |
32956 |
21612 |
|
With disinfection at SCISTW |
|||||||||
|
SCISTW effluent (with disinfection) |
393 |
476 |
267 |
369 |
451 |
262 |
52 |
63 |
38 |
|
Other background sources ** |
8412 |
22120 |
2888 |
7193 |
21298 |
2611 |
2213 |
1291 |
2522 |
|
Total |
8805 |
22596 |
3155 |
7562 |
21749 |
2873 |
2265 |
1354 |
2560 |
Shaded cell – exceedance of WSD standard.
** The major background sources are described in Section 5.129.
Table 5.37 Predicted Maximum E.coli Levels at WSD Flushing Water Intakes - Dry Season
|
|
2009 (ADF Stage) |
2013 (ADF Stage) |
2020 (Stage 2A) |
||||||
|
Pollution Source
|
WSD18 |
WSD19 |
WSD20 |
WSD18 |
WSD19 |
WSD20 |
WSD18 |
WSD19 |
WSD20 |
|
Maximum Level (no. per 100 ml) |
|||||||||
|
WSD Standard: |
<20000 at any time |
||||||||
|
Without disinfection at SCISTW |
|||||||||
|
SCISTW effluent (w/o disinfection) |
17136 |
18730 |
25741 |
17034 |
18574 |
26020 |
25567 |
26213 |
38875 |
|
Other background sources ** |
6864 |
9826 |
2721 |
6615 |
9864 |
2697 |
3224 |
4633 |
3024 |
|
Total |
24000 |
28556 |
28462 |
23649 |
28438 |
28717 |
28791 |
30846 |
41899 |
|
With disinfection at SCISTW |
|||||||||
|
SCISTW effluent (with disinfection) |
343 |
375 |
515 |
341 |
371 |
520 |
51 |
52 |
78 |
|
Other background sources ** |
6864 |
9826 |
2721 |
6615 |
9864 |
2697 |
3224 |
4633 |
3024 |
|
Total |
7207 |
10201 |
3236 |
6956 |
10235 |
3217 |
3275 |
4685 |
3102 |
Shaded cell – exceedance of WSD standard.
** The major background sources are described in Section 5.129.
5.152 The maximum E.coli levels predicted at all the three WSD flushing water intakes in western Victoria Harbour would exceed the WSD standard of 20000 no. per 100 ml under the baseline scenarios (i.e. without disinfection at SCISTW) for ADF stage (2009 and 2013) and Stage 2A (2020). The model results showed that the provision of disinfection at SCISTW would significantly reduce the E.coli levels at the intake point but the predicted maximum values would still breach the WSD standard at Sheung Wan during ADF stage (2009 and 2013) because of the contribution from the background source.
5.153 The residual impact predicted at Sheung Wan (with the Project commissioned) during ADF stage was mainly contributed by the sewage effluent discharged from the Central PTW outfall which is situated in close proximity of the intake point. The absolute levels contributed from the disinfected effluent from SCISTW at Sheung Wan ranged from 371 to 451 no. per 100 ml only which were low as compared to the background levels of 9864 to 21298 no. per 100 ml and the WSD standard of 20000 no. per 100 ml. It can be seen that the background values predicted at Sheung Wan were substantially smaller under Stage 2A when effluent from Central PTW is intercepted to the SCISTW by the HATS Stage 2A sewage conveyance system. HATS Stage 2A is scheduled for implementation in 2014 and the improvement at Sheung Wan intake is expected to be seen thereafter. The model results as shown in the table above indicated that full compliance with the WSD standard would be achieved at Sheung Wan in 2020 at the late stage of HATS 2A with the provision of disinfection facilities at SCISTW.
5.154 Table 5.38 and Table 5.39 tabulate the maximum E.coli levels predicted at the three WSD flushing water intakes for Stage 2B (ultimate scenario). To address the uncertainty of the biological treatment process for HATS Stage 2B, sensitivity analysis was carried out using both the effluent E.coli value of 2.95+E5 no. per 100 ml and a more adverse E.coli level of 1E+6 no. per 100 ml for the undisinfected effluent. The model results indicated that full compliance with the WSD standard would be achieved at Stage 2B under both the “with disinfection at SCISTW” case and the “without disinfection at SCISTW” case.
Table 5.38 Predicted Maximum E.coli Levels at WSD Flushing Water Intakes for Stage 2B - Wet Season
|
Pollution Source
|
WSD18 |
WSD19 |
WSD20 |
|
Maximum Level (no. per 100 ml) |
|||
|
WQO: |
<20000 at any time |
||
|
Scenario 4a – without disinfection at SCISTW (base case scenario using an effluent E.coli value of 2.96E+5 per 100ml) |
|||
|
SCISTW effluent (w/o disinfection) |
858 |
1033 |
626 |
|
Other background sources** |
2893 |
1466 |
2913 |
|
Total |
3751 |
2499 |
3539 |
|
Scenario 4b – with disinfection at SCISTW (base case scenario using an effluent E.coli value of 2E+4 per 100ml) |
|||
|
SCISTW effluent (with disinfection) |
58 |
70 |
42 |
|
Other background sources** |
2893 |
1466 |
2913 |
|
Total |
2951 |
1536 |
2956 |
Shaded cell – exceedance of WSD standard.
** The major background sources are described in Section 5.129.
Table 5.93 Predicted Maximum E.coli Levels at WSD Flushing Water Intakes for Stage 2B - Dry Season
|
Pollution Source
|
WSD18 |
WSD19 |
WSD20 |
|
Maximum Level (no. per 100 ml) |
|||
|
WQO: |
<20000 at any time |
||
|
Scenario 4a – without disinfection at SCISTW (base case scenario using an effluent E.coli value of 2.96E+5 per 100ml) |
|||
|
SCISTW effluent (w/o disinfection) |
915 |
925 |
1398 |
|
Other background sources** |
3769 |
5274 |
3422 |
|
Total |
4684 |
6199 |
4820 |
|
Scenario 4b – with disinfection at SCISTW (base case scenario using an effluent E.coli value of 2E+4 per 100ml) |
|||
|
SCISTW effluent (with disinfection) |
62 |
63 |
95 |
|
Other background sources** |
3769 |
5274 |
3422 |
|
Total |
3831 |
5337 |
3516 |
Shaded cell – exceedance of WSD standard.
** The major background sources are described in Section 5.129.
5.155 The model results indicated that the recommended disinfection level for SCISTW would be adequate to protect the flushing water intakes in western Harbour.
Secondary Contact Recreation Subzones
5.156 The water quality impacts upon the secondary contact recreation subzones are assessed in subsequent sections based on the optimum effluent E.coli standards recommended for protection of the Tsuen Wan beaches (i.e. 200,000 no. per 100 ml for ADF stage and 20,000 no. per 100 ml for Stage 2A and Stage 2B).
5.157 Figure 5.9 and Figure 5.10 show that, without disinfection at SCISTW, the E.coli levels predicted at the secondary contact subzones along the Tsuen Wan and Tuen Mun coast would exceed the WQO of 610 no. per 100 ml in 2009. For 2013 and 2020, the exceedances were only predicted at the Tsuen Wan coast due to the reduction in the background pollution loading in North Western WCZ.
5.158 With the provision of disinfection facilities at SCISTW, full compliance with the WQO was predicted at the secondary contact subzones along the Tsuen Wan coast for ADF stage (2009 and 2013) and Stage 2A (2020).
5.159 Some residual impacts were however predicted at the secondary contact subzones along Tuen Mun coast which were shown to be the result of other background pollution sources in the modelling area and were not related to the SCISTW effluent. Figure 5.13 and Figure 5.14 indicated that the influence zone of the disinfected HATS effluent plume would be very localized in close proximity of the SCISTW outfall, and would not contribute to any impact on the secondary contact recreation zones.
5.160 The model results indicated that the recommended disinfection level for SCISTW would be adequate to protect the beneficial uses of the secondary contact recreation subzones.
Sensitivity Analysis to the Schedule of Stage 2B Implementation
5.161 For this water quality modelling and assessment, it is assumed in the base case scenarios that Stage 2B would be implemented by 2021. In fact, the schedule of Stage 2B implementation would be subject to the review on population / flow build-ups and water quality conditions to be conducted in 2010/2011. Based on the assessment results, the same effluent E.coli standards of 20,000 no. per 100 ml would be maintained for both Stage 2A and Stage 2B. It is therefore considered that the possible change to the schedule of Stage 2B implementation would not be an issue of concern with regard the potential E.coli impacts upon the receiving marine waters and water sensitive receivers. It should be noted that the effluent from Stage 2B would have a greater effect on the receiving water as compared to the Stage 2A conditions as the effluent flow rate for Stage 2B would be higher. The model predicted that the effluent from Stage 2B under the ultimate flow condition with the recommended E.coli standard of 20,000 no. per 100 ml would not cause any unacceptable impacts to the identified sensitive receivers as discussed in previous sections.
Whole Effluent Toxicity Test
5.162 Whole effluent toxicity test (WETT) was conducted to determine the whole effluent toxicity of C/D CEPT effluent from SCISTW and C/D secondary treated effluent from Tai Po Sewage Treatment Works (TPSTW) and Sha Tin Sewage Treatment Works (STSTW) for the following five local marine species:
l Amphipod (Melita longidactyla), with 48-hour survival test
l Barnacle larvae (Balanus amphitrite), with 48-hour survival test
l Fish (Lutjanus malabaricus), with 48-hour survival test
l Shrimp (Metapenaeus ensis), with 48-hour survival test
l Diatom (Skeletonema costatum), with 7-day growth inhibition test
5.163 The toxicity tests for amphipod, barnacle larvae, fish and shrimp were conducted to determine the acute toxicity of the effluents to the 4 animal species while the toxicity tests for diatom were to determine the chronic toxicity of the effluents to plants. Table 5.40a and Table 5.40b summarize the results obtained in the WETT for CEPT effluent whilst Table 5.41a and Table 5.41b give the results for secondary treated effluent.
Table 5.40a Summary of WETT Result for CEPT Effluent (Acute Toxicity)
|
NOEC b |
NOEC b |
|||
Note: a48-hr LC50, the lethal concentration of effluent to 50% of test animals after 48 hours of exposure.
b No-Observable-Effect-Concentration, the highest concentration of effluent producing effects not significantly different from responses to controls
N.D = Not Determined, less than 50% mortality was recorded when animal species were exposed to the highest concentration of effluent
Table 5.40b Summary of WETT Result for CEPT Effluent (Chronic Toxicity)
Note: a7-day IC50, the inhibition concentration to 50% of organisms after 7 days of exposure.
b No-Observable-Effect-Concentration, the highest concentration of effluent producing effects not significantly different from responses to controls
Table 5.41a Summary of WETT Result for Secondary Treated Effluent (Acute Toxicity)
N.D = Not Determined,
1 LC50 could not be determined - less than 50% mortality was recorded when animal species were exposed to the highest concentration of effluent
2 NOEC could not be determined - the highest concentration of effluent did not produce effects significantly different from controls
Table 5.41b Summary of WETT Result for Secondary Treated Effluent (Chronic Toxicity)
N.D = Not Determined,
1 IC50 could not be determined - less than 50% growth inhibition was recorded when plant species were exposed to the highest concentration of effluent
2 NOEC could not be determined - the highest concentration of effluent did not produce effects significantly different from controls
5.164 The WETT results indicated that both raw CEPT effluent and C/D CEPT effluent generally do not exert acute toxicity effect to amphipod, fish and shrimp as no 48-hr LC50 was determined (Table 5.40a). However, LC50 and IC50 were observed for barnacle larvae and diatom respectively which implied that some degree of acute toxicity and chronic toxicity effect was exerted on barnacle larvae and diatom respectively from both the raw CEPT effluent and C/D CEPT effluent.
5.165 Statistical analysis was conducted for the toxicity test data of barnacle larvae and diatom to determine whether C/D process induced additional toxicity in the CEPT effluent. Two-way analysis of variance (ANOVA) test using software SigmaStat was conducted, which compares the difference between the toxicity data of composite CEPT effluent and C/D CEPT effluent with consideration of the effects of difference in effluent concentrations. The analysis showed that the C/D process did not induce statistically significant difference to the toxic effect in CEPT effluent to barnacle larvae and diatom, i.e. the C/D process did not induce additional toxicity.
5.166 Based on the WETT test conducted for the effluent from TPSTW and STSTW, no LC50 values could be derived for fish, shrimp, amphipod and barnacle larvae due to the low mortality (Table 5.41a). Also, no IC50 value could be calculated as the maximum growth inhibition for diatoms was low. Based on the statistical tests, no significant differences were found between the seawater control and various strengths (up to 100%) of raw and C/D secondary treated effluent samples. Hence, it was concluded that the C/D secondary treated effluent samples would not pose any acute or chronic toxicity to the test organisms.
Far Field Modelling Results for TRC and CBP
5.167 Far field water quality modelling was conducted for TRC and 34 CBP compounds as listed in Table 5.9a. The model results have taken into account other concurrent discharges such as Pillar Point STW, Sha Tin STW and Tai Po STW where chlorination and dechlorination were assumed to be their disinfection method for worst-case assessment. Possible discharges of TRC and CBP from spent cooling water were also included in the model for cumulative assessment. The initial CBP levels assumed in the effluent discharges and other concurrent discharges are based on the laboratory CBP testing in the C/D effluent samples as discussed in Section 5.78.
5.168 The contour plots for TRC are shown in Figure 5.22 and Figure 5.23. These contour plots present the maximum values predicted over the whole model simulation period. The model results showed that the predicted maximum values at and near the SCISTW outfall complied well the assessment criterion of 0.008 mg/l. The contour plots indicated some localized TRC exceedances along the coastlines. These localized exceedances were contributed from the background sources and were not related to the HATS discharges.
5.169 The predicted maximum values for all the identified CBP compounds complied well with their corresponding ambient water objectives as shown in Table 5.9a. The model results are presented as contour plots for selected CBP compounds including dichloroacetic acid, trichloroacetic acid, dibromoacetic acid and bromoform in Figure 5.24 to Figure 5.31. The contour plots showed that the predicted maximum levels of dichloroacetic acid were higher than the measured ambient levels near the outfall location under ADF stage and Stage 2A during both dry and wet season. The predicted maximum levels of trichloroacidic acid were also higher than the measured ambient levels during ADF stage and Stage 2A under the wet season scenarios. The predicted maximum levels for bromoform and dibromoacetic acid exceeded the measured ambient levels near the outfall location during Stage 2B under the wet season scenarios. The predicted maximum values for all the remaining CBP compounds were within the measured ambient levels.
5.170 Amongst all the 34 CBP compounds, the mixing zones of dichloroacetic acid (during ADF stage and Stage 2A) and bromoform (during Stage 2B) were predicted to be the largest. Table 5.42 shows the maximum dimensions of their mixing zones. These mixing zones would however be limited in areas close to the SCISTW submarine outfall to the south of Tsing Yi Island. The approximate location and extent of the mixing zone with respect to the SCISTW outfall are given in Figure 5.31a. It should be hightlighted that the mixing zone dimensions provided in this EIA represent a conservative estimation as they were established based on the maximum values predicted over the entire simulation period.
Table 5.42 Maximum Dimensions of Mixing Zones for CBP See Notes 1 and 2
|
Scenarios |
Chemical |
Maximum Dimension of Mixing Zone (m2) |
Minimum Dilution at the Edge of Mixing Zone |
Figure Reference |
|
|
Wet Season |
Dry Season |
||||
|
2009 - ADF Stage |
Dichloroacetic acid Note 1 |
1385 x 1105 |
1110 x 460 |
62 |
5.24 and 5.25 |
|
2013 - ADF Stage |
Dichloroacetic acid Note 1 |
1400 x 1505 |
1110 x 460 |
60 |
5.24 and 5.25 |
|
2020 – Stage 2A |
Dichloroacetic acid Note 1 |
1685 x 2450 |
1400 x 1505 |
50 |
5.24 and 5.25 |
|
Ultimate - Stage 2B |
Bromoform Note 2 |
1385 x 925 |
See Note 3 |
43 |
5.28 and 5.29 |
Notes:
1. No water quality standard is available for dichloroacetic acid. The maximum mixing zone provided in this table was determined by applying the measured ambient level in Table 5.15. As the ambient levels for dichloroacetic acid were below the detection limit, the detection limit of dechloroacetic acid was applied as the criterion to determine the size of mixing zone.
2. Water quality standard is available for bromoform as shown in Table 5.9a. Based on the established water quality standard for bromoform, no mixing zone can be identified as all the predicted maximum bromoform values complied well with the standard. The maximum mixing zone provided in this table was determined by applying the measured ambient level in Table 5.15. As the ambient levels for bromoform were below the detection limit, the detection limit of bromoform was applied as the criterion to determine the size of mixing zone.
3. The predicted maximum levels of bromoform were all below the detection limit under the dry season (see Figure 5.29)..
5.171 Table 5.19 indicated that the maximum dichloroacetic acid level measured in the C/D CEPT effluent was 45.9 µg/l and the maximum bromoform level measured in the C/D secondary treated effluent was 49 µg/l. Based on the dilution rates of 62, 60 and 50 for ADF stage (2009 and 2013) and late Stage 2A (2020) as shown in Table 5.42, the predicted concentration of dichloroacetic acid at the edge of mixing zone would be around 1 µg/l only. Based on the dilution rate of 43 for ultimate year as shown in Table 5.42, the predicted concentration of bromoform at the edge of mixing zone would also be about 1 µg/L only which complied well with the water quality standard for bromoform of 360µg/l (refer to Table 5.9a). There is no existing available marine water quality standard for dichloroacetic acid.
5.172 Based on the minimum dilution at the edge of mixing zone as shown in Table 5.42, the chronic toxicity unit (TUc) ([5]) at the edge of the mixing zone was calculated for the CEPT effluent and the results are summarized in Table 5.43.
Table 5.43 Summary of Chronic Toxicity Unit (TUc) at Edge of Mixing Zone
|
Scenario |
Minimum Dilution Factor |
NOEC Detected for Diatom in the WETT 1 |
TUc at Effluent 2 |
Predicted TUc at Edge of Mixing Zone 3 |
Criterion (mg/l) 4 |
% of Criterion |
|
2009 - ADF Stage |
62 |
27.2% |
3.68 |
0.059 |
1 |
6% |
|
2013 - ADF Stage |
60 |
0.061 |
6% |
|||
|
2020 - Stage 2A |
50 |
0.074 |
7% |
Note:
1. NOEC of 27.2% was detected in C/D CEPT effluent for diatom (see Section 5.162 to Section 5.166)
2. TUc = 100/NOEC
3. TUc at edge of mixing zone = TUc at effluent / minimum dilution
4. Toxicity criterion for far field modelling (see Table 5.9a)
5.173 As shown in Table 5.43, the predicted TUc at the edge of mixing zone for the 2009, 2013 and 2020 scenarios would be 0.059, 0.061 and 0.074 respectively which are well below the criterion of 1.
5.174 As discussed in Section 5.166, the C/D secondary treated effluent samples would not pose any chronic toxicity to the diatom. Therefore, no TUc was determined for the C/D secondary treated effluent.
5.175 It is noted that the TRC and CBP results in Figure 5.22 to Figure 5.31 indicate a sizable mixing zone for a number of background cooling water discharges. It should be highlighted that the TRC and CBP results for these background sources are based on some very conservative assumptions. The peak discharge flow rates of the cooling water systems were applied to the model continuously (that is, 24 hours daily). For cooling water where no information on the residual chlorine level is available, the maximum chlorine dose rates were directly applied to calculate the TRC loading for model input which, again, represents a very adverse scenario. In reality, the peak flow rates would occur during a short period of time within a day and the chlorine would be decayed within the cooling water systems. Therefore, the actual chlorine contents in the cooling water discharges should be significantly smaller than that assumed in the model. In addition, the mixing zone dimensions provided in this EIA represent a conservative estimation as they were established based on the maximum values predicted over the entire simulation period. The background cooling water discharges are included in the model only for the purpose of addressing the possible worst-case cumulative impact with the HATS effluent. The model results indicated that the C/D HATS effluent would not cause any cumulative TRC and CBP impact with all other concurrent discharges assumed in the model.
Near Field Modelling Results for TRC and Acute Toxicity
5.176 TRC concentrations at the edge of the zone of initial dilution (ZID) were calculated based on the near field modelling results as given in Appendix 5-1. The TRC standard of 0.2 mg/l (at 95%ile) was assumed as the TRC concentration in the C/D HATS effluent for the purpose of near field modelling.
5.177 Based on the HATS survey data, the measured ambient TRC levels in the marine water were all under the detection limit. Given the fact that TRC would undergo decay in marine water, it is anticipated that the ambient TRC concentration, if any, would be minimal. Thus, for the purpose of calculation, the ambient TRC concentration was assumed to be negligible.
5.178 Based on the minimum initial dilutions predicted by the near field model, the TRC concentration at the edge of the ZID was calculated and the results are summarized in Table 5.44.
Table 5.44 Summary of TRC Levels at Edge of ZID
|
Scenario |
Minimum Initial Dilution |
TRC concentration at Effluent (mg/l)1 |
Predicted Concentration at Edge of ZID (mg/l) 2 |
Criterion (mg/l) 3 |
% of Criterion |
|
2009 |
47 |
0.2 |
0.0043 |
<0.013 |
33% |
|
2013 |
48 |
0.0042 |
32% |
||
|
2020 |
36 |
0.0056 |
43% |
||
|
Ultimate |
34 |
0.0059 |
45% |
Note:
1. TRC standard at 95%ile
2. TRC at edge of ZID = TRC at effluent / minimum initial dilution
3. TRC criterion for near field modelling (see Table 5.9b)
5.179 As shown in Table 5.44, with TRC concentration at effluent as 0.2 mg/l, the predicted TRC concentrations at the edge of ZID for the 2009, 2013, 2020 and ultimate scenarios would be 0.0043, 0.0042, 0.0056 and 0.0059 mg/l respectively which are well below the criterion of 0.013 mg/l.
5.180 As indicated in Appendix 5-1, the average dimension of the ZID would be about 1220 x100 m2. It should be noted that the length of ZID (1220m) has taken into account the outfall diffuser length of 1200m. Thus, the predicted effluent plume width from the diffuser is only about 10m. The main flow direction would be perpendicular to the diffuser length where the predicted downstream distance of the effluent plume from the diffuser is only about 50m. The edge of the ZID is therefore within 100m away from the outfall diffuser. The approximate location and extent of the ZID with respect to the SCISTW outfall are given in Figure 5.31a.
5.181 Based on the minimum initial dilutions predicted by the near field model, the acute toxicity unit (TUa) ([6]) at the edge of the ZID was calculated and the results are summarized in Table 5.45.
Table 5.45 Summary of Acute Toxicity Unit (TUa) at Edge of ZID
|
Scenario |
Minimum Initial Dilution |
LC50 Detected for Barnacle Larvae in the WETT 1 |
TUa at Effluent 2 |
Predicted TUa at Edge of ZID (mg/l) 3 |
Criterion 4 |
% of Criterion |
|
2009 - ADF Stage |
47 |
40.2% |
2.49 |
0.053 |
<0.3 |
18% |
|
2013 - ADF Stage |
48 |
0.052 |
17% |
|||
|
2020 - Stage 2A |
36 |
0.069 |
23% |
Note:
1. Lowest LC50 of 40.2% was detected in C/D CEPT effluent for barnacle larva (see Section 5.162 to Section 5.166)
2. TUa = 100/LC50
3. TUa at edge of ZID = TUa at effluent / minimum initial dilution
4. Toxicity criterion for near field modelling (see Table 5.9b)
5.182 As shown in Table 5.45, the predicted TUa at the edge of ZID for the 2009, 2013 and 2020 scenarios would be 0.053, 0.052 and 0.069 respectively which are well below the criterion of 0.3. Details of the near field model results and the dimensions of the ZID are given in Appendix 5-1.
5.183 As discussed in Section 5.166, the C/D secondary treated effluent samples would not pose any acute toxicity to the test organisms. Therefore, no TUa was determined for the C/D secondary treated effluent.
5.184 It should be noted that the TRC levels measured in the C/D CEPT effluent used for the WETT tests ranged from 0.02 to 0.1 mg/l (see Table 5.19) which are lower than the proposed TRC discharge standards (0.2 mg/l at 95%ile and 0.4 mg/l at maximum) for the HATS effluent. It is however expected that the TRC discharged from the Project would easily be dispersed by the fast moving tidal currents at the submarine outfall and would be diluted many times in close proximity of the outfall. Based on the tracer dilution modelling results, the effluent would be diluted more than 10 times at the immediate vicinity of the SCISTW outfall. Moreover, as shown in Table 5.45, there is a great safety margin of over 75% between the predicted TUa and the assessment criterion. It is therefore unlikely that the Project would induce any acute toxicity on the marine environment. More detailed discussion on the acute and chronic toxicity of the Project effluent is provided under the human health and ecological risk assessment in Section 6.
Impact Due to Possible Change of Coastline Configurations
5.185 A sensitivity test, namely Scenario 3e, was conducted under this Study to investigate the effect of possible change in coastline configurations in Victoria Harbour on the overall conclusion of the water quality assessment. Modelling was undertaken for Scenario 3b (Table 5.20) using an alternate coastline configuration. The alternate coastline configurations have included three additional reclamations (i.e. SEKD, WDII and YTBR respectively) as shown in Figure 5.7.
5.186 The E.coli contour plots for this sensitivity test are shown in Figure 5.32. Appendix 5-7 tabulates the sensitivity results for E.coli at the water sensitive receivers. The results for Scenario 3b (using the original coastline as shown in Figure 5.6) are also presented in Figure 5.32 and Appendix 5-7 for comparison. The model results indicated that no significant change in the degree of E.coli impact was observed due to the change of coastline configurations.
5.187 Figure 5.33 shows TRC results for this sensitivity test. The results showed that there was no obvious change in the TRC concentration pattern due to change of coastline in Victoria Harbour.
5.188 Based on the model results, the change of coastlines from Scenario 3b (no reclamation at all) to Scenario 3e (maximum extent of reclamations as in previous approved EIA) would not cause significant difference in the model results. It is therefore not expected that the latest concept plans for WDII and SEKD which involve a lesser extent of reclamation would cause any significant difference in the model results. It is considered that the possible change of coastline in Victoria Harbour would unlikely affect the overall conclusion of the impact assessment.
Potential Effect on Red Tide Formation
5.189 The WETT results indicated that some degree of chronic toxicity effect was exerted on diatom from the raw CEPT effluent and C/D CEPT effluent. Reduced diatom population in the marine water may favour the growth of other plant species and hence the species composition may be changed by the Project effluent, which could result in promoting the formation of harmful algal bloom. From the WETT test results, NOEC to diatom was 27.2% effluent, which implied that there would be no effect to the diatom if the effluent is diluted 5 times or more. Based on the tracer dilution modelling results, the effluent would be diluted more than 10 times at the immediate vicinity of the SCISTW outfall. As shown in Table 5.42, the effluent would be diluted at least 34 times at the edge of ZID. It is therefore considered that the Project would unlikely induce any chronic effect on the algal populations in the receiving water.
Potential Oxygen Depletion Due to the Addition of Dechlorination Chemical
5.190 The upper limits of the operational range for sodium bisulphite dosage of 11 mg/l, 4 mg/l and 2 mg/l for ADF, Stage 2A and Stage 2B respectively were assumed as the sodium bisulphite concentration in the C/D HATS effluent for water quality modelling which is a conservative approach.
5.191 The average and maximum levels of oxygen depletion predicted at the Project discharge point are given in Table 5.46. The mean ambient oxygen levels predicted under the baseline scenarios (without the Project) at different year horizons are graphically presented in Figure 5.34 and Figure 5.35 for wet and dry seasons respectively. Based on the EPD routine monitoring data, the mean ambient oxygen levels measured near the Project discharge point were 5.8 and 5.9 mg/l at stations WM3 and VM8 respectively in 2004 which accorded with the values predicted by the model as shown in Figure 5.34 and Figure 5.35. It should be noted that the oxygen depletion as shown in Table 5.46 is based on the values extracted from the grid cell in which the SCISTW outfall was located. The size of the grid cells at or near the SCISTW outfall is approximately 140 m x 120 m. The oxygen depletion at the grid cell immediately adjacent to the outfall grid cells was at least 2 times smaller. The predicted oxygen depletions are considered insignificant.
Table 5.46 Predicted Oxygen Depletion at the SCISTW Outfall Location
|
Scenario |
Dry Season |
Wet Season |
|||||||
|
Average |
Maximum |
Average |
Maximum |
||||||
|
Value (mg/l) |
% Decrease |
Value (mg/l) |
% Decrease |
Value (mg/l) |
% Decrease |
Value (mg/l) |
% Decrease |
||
|
2009 – ADF Stage |
0.021 |
0.36% |
0.042 |
0.72% |
0.028 |
0.48% |
0.077 |
1.33% |
|
|
2013 – ADF Stage |
0.021 |
0.36% |
0.042 |
0.72% |
0.028 |
0.48% |
0.077 |
1.33% |
|
|
2020 – Stage 2A |
0.013 |
0.23% |
0.021 |
0.37% |
0.013 |
0.23% |
0.037 |
0.64% |
|
|
Ultimate Year – Stage 2B |
0.007 |
0.11% |
0.012 |
0.21% |
0.012 |
0.21% |
0.028 |
0.48% |
|
Note: The % decrease was calculated using the mean ambient oxygen levels measured near the SCISTW outfall at EPD station WM3 in 2004.
5.192 The oxygen depletions shown in Table 5.46 represent a very worse condition as the maximum chemical dosage was assumed to be the effluent concentrations. In reality, the chemical would react with chlorine and consumed within the dechlorination facilities and the diffuser systems. The actual concentration of the dechlorination chemical in the effluent should be much smaller than the dosage value. Thus, it is expected that the oxygen depletion caused by the Project would be negligible.
Emergency Situations
Temporary Failure of Chlorination Plant
5.193 This section addresses the potential impact on the beaches in Tsuen Wan District and the WSD flushing water intakes in western Victoria Harbour during emergency situations. Impacts on Ma Wan FCZ under the emergency situations are not presented because the model predicted that the water quality at Ma Wan FCZ would comply with the WQO of 610 no. per 100 ml under the “without Project” scenarios as shown in Appendix 5-5 to Appendix 5-8. Year 2009, 2013 and 2020 scenarios were selected for modelling. For each assessment year, modelling was carried out for two emergency discharge periods of 6 hours and 24 hours respectively. It should be highlighted that the past emergency discharge records available from various sewage treatment works indicated that the longest period of emergency discharge would be less than 6 hours. Thus, the scenario of emergency discharge for 24 hours is an extremely remote case for the purpose of worst-case assessment only.
5.194 For each of the scenarios, two separate model runs were conducted for the discharge periods centred at neap tide low water and spring tide mid-flood respectively for both wet and dry seasons. Figure 5.36 to Figure 5.41 contain the contour plots showing the maximum E.coli values predicted under the emergency situations for reference. The maximum values predicted under the normal operation scenario are also included in Figure 5.36 to Figure 5.41 for comparison.
5.195 It should be noted that E.coli levels based on geometric means were used to depict the existing and normal operation scenarios as given in Figure 5.9 to Figure 5.21, whereas the predicted peak E.coli levels were used to assess the impacts due to emergency discharge of undisinfected effluent as given in Figure 5.36 to Figure 5.41. The E.coli values presented for “normal operation” scenarios are geometric means over the entire 30-day simulation period which cannot reflect the short term impacts of the emergency discharge for over a 6-hour or 24-hour period. Description of the elevation / trend of E.coli levels during and after the emergency discharge period (as compared to the normal condition with disinfection at SCISTW) is provided in the subsequent sections to indicate the impact from emergency discharge.
5.196 The model results for 2009 are presented as time series plots for E.coli covering the periods before, during and after the emergency discharges in Appendix 5-9 to Appendix 5-12. The predicted results for the normal operation scenarios are also included in these time series plots for comparison. The indicator points selected for presentation include eight Tsuen Wan beaches (namely B7, B8, B9, B10, B11, B12, B13 and B14) and three WSD flushing water intakes (namely WSD18, WSD19 and WSD20). The results provided for the Tsuen Wan beaches are depth-average values whereas those for the WSD flushing water intakes represent the middle water layer. Figure 5.1 shows these indicator points.
5.197 During the emergency discharge period, it is likely that the water quality at the Tsuen Wan beaches would be affected. Appendix 5-9 to Appendix 5-12 showed that elevations of E.coli levels are predicted immediately after the start of emergency discharge. The trends of E.coli levels shown in the appendices indicated that the E.coli levels would sharply increase after the emergency discharge. The peak levels would last for only several hours and the levels would then significantly drop. The normal water quality conditions (i.e. the conditions under normal operation of the disinfection facilities) are predicted to recover within 2 days from the start of the emergency period under various discharge scenarios. The time series plots for 2013 and 2020 are similar to that for 2009 and are therefore not presented. During the emergency discharge periods, the magnitudes of impacts predicted at Anglers’, Gemini and Hoi Mei Wan are considered high. The elevations predicted at Casam, Lido, Ting Kau, Approach and Ma Wan are relatively smaller. It was found that, in dry seasons, the predicted E.coli elevations at Approach are negligible under all the emergency discharge scenarios. The likely range of E.coli levels predicted at the beaches under normal operation scenarios is also shown in Appendix 5-9 to Appendix 5-12 for comparison.
5.198 Scenario 5b, Scenario 6b and Scenario 7b represent a very worst case of emergency discharge for 24 hours. Relatively less impact on the sensitive receivers was predicted for the discharge of undisinfected effluent for 6 hours.
5.199 The worst impacts from emergency discharge would occur at the late phase of Stage 2A before commissioning of Stage 2B. The impacts for 2009 and 2013 scenarios are expected to be smaller. The predicted impacts in 2013 are generally smaller than that in 2009 due to the reduction of background pollution sources in 2013 as discussed in Section 5.131.
5.200 Table 5.47 below shows the geometric mean E.coli values predicted at the beaches under the emergency situations for comparison with the WQO. The values shown in Table 5.47 are the average values predicted over the 30-day simulation periods. The geometric mean values predicted under the normal operation scenarios are also included in Table 5.47 for comparison. As previously mentioned, geometric means over the 30-day simulation period cannot reflect the short term impacts of the emergency discharge for over a 6-hour or 24-hour period. The geometric mean E.coli values in Table 5.47 below are presented for reference and comparison with the WQO which is also a geometric mean.
Table 5.47 Predicted Geometric Mean E.coli Levels under Emergency Situations
|
Discharge Scenario |
Geometric Mean Depth-averaged E.coli level (no. per 100 ml) See Note 1 |
|||||||
|
Anglers’ |
Gemini |
Hoi Mei Wan |
Casam |
Lido |
Ting Kau |
Approach |
Ma Wan |
|
|
WQO: |
180 |
|||||||
|
Year 2009 – HATS ADF Stage - Wet Season |
||||||||
|
Scenario 5a - Emergency discharge at Neap Tide for 6 hours |
281 |
307 |
213 |
312 |
289 |
318 |
248 |
146 |
|
Scenario 5a -Emergency discharge at Spring Tide for 6 hours |
278 |
305 |
210 |
310 |
288 |
318 |
246 |
144 |
|
Scenario 1b - Normal Operation |
273 |
298 |
205 |
308 |
286 |
316 |
244 |
140 |
|
Year 2009 – HATS ADF Stage - Wet Season (Sensitivity Test) See Note 2 |
||||||||
|
Scenario 5b - Emergency discharge at Neap Tide for 24 hours |
288 |
315 |
220 |
315 |
291 |
320 |
252 |
152 |
|
Scenario 5b -Emergency discharge at Spring Tide for 24 hours |
286 |
314 |
216 |
314 |
292 |
321 |
250 |
149 |
|
Scenario 1b - Normal Operation |
273 |
298 |
205 |
308 |
286 |
316 |
244 |
140 |
|
Year 2009 – HATS ADF Stage - Dry Season |
||||||||
|
Scenario 5a - Emergency discharge at Neap Tide for 6 hours |
167 |
165 |
131 |
127 |
109 |
199 |
448 |
23 |
|
Scenario 5a -Emergency discharge at Spring Tide for 6 hours |
166 |
163 |
128 |
128 |
108 |
199 |
447 |
22 |
|
Scenario 1b - Normal Operation |
161 |
158 |
124 |
126 |
106 |
197 |
443 |
21 |
|
Year 2009 – HATS ADF Stage - Dry Season (Sensitivity Test) See Note 2 |
||||||||
|
Scenario 5b - Emergency discharge at Neap Tide for 24 hours |
173 |
172 |
136 |
129 |
111 |
201 |
452 |
24 |
|
Scenario 5b -Emergency discharge at Spring Tide for 24 hours |
171 |
168 |
133 |
130 |
110 |
200 |
451 |
23 |
|
Scenario 1b - Normal Operation |
161 |
158 |
124 |
126 |
106 |
197 |
443 |
21 |
|
Year 2013 – HATS ADF Stage - Wet Season |
||||||||
|
Scenario 6a - Emergency discharge at Neap Tide for 6 hours |
112 |
153 |
88 |
152 |
122 |
162 |
96 |
61 |
|
Scenario 6a -Emergency discharge at Spring Tide for 6 hours |
111 |
153 |
87 |
151 |
122 |
162 |
95 |
60 |
|
Scenario 2b - Normal Operation |
108 |
149 |
84 |
150 |
121 |
161 |
94 |
58 |
|
Year 2013 – HATS ADF Stage - Wet Season (Sensitivity Test) See Note 2 |
||||||||
|
Scenario 6b - Emergency discharge at Neap Tide for 24 hours |
115 |
158 |
91 |
153 |
123 |
163 |
97 |
64 |
|
Scenario 6b -Emergency discharge at Spring Tide for 24 hours |
115 |
159 |
90 |
153 |
124 |
164 |
97 |
62 |
|
Scenario 2b - Normal Operation |
108 |
149 |
84 |
150 |
121 |
161 |
94 |
58 |
|
Year 2013 – HATS ADF Stage – Dry Season |
||||||||
|
Scenario 6a - Emergency discharge at Neap Tide for 6 hours |
114 |
118 |
92 |
103 |
80 |
171 |
367 |
14 |
|
Scenario 6a -Emergency discharge at Spring Tide for 6 hours |
113 |
116 |
91 |
104 |
80 |
171 |
367 |
13 |
|
Scenario 2b - Normal Operation |
110 |
113 |
88 |
102 |
79 |
169 |
363 |
13 |
|
Year 2013 – HATS ADF Stage – Dry Season (Sensitivity Test) See Note 2 |
||||||||
|
Scenario 6b - Emergency discharge at Neap Tide for 24 hours |
117 |
122 |
97 |
104 |
82 |
172 |
371 |
14 |
|
Scenario 6b -Emergency discharge at Spring Tide for 24 hours |
117 |
120 |
95 |
106 |
82 |
172 |
371 |
14 |
|
Scenario 2b - Normal Operation |
110 |
113 |
88 |
102 |
79 |
169 |
363 |
13 |
|
Year 2020 – HATS Stage 2A – Wet Season |
||||||||
|
Scenario 7a - Emergency discharge at Neap Tide for 6 hours |
78 |
92 |
50 |
152 |
118 |
168 |
83 |
42 |
|
Scenario 7a -Emergency discharge at Spring Tide for 6 hours |
78 |
92 |
49 |
152 |
118 |
168 |
83 |
41 |
|
Scenario 3b - Normal Operation |
74 |
88 |
47 |
150 |
117 |
167 |
81 |
39 |
|
Year 2020 – HATS Stage 2A - Wet Season (Sensitivity Test) See Note 2 |
||||||||
|
Scenario 7b - Emergency discharge at Neap Tide for 6 hours |
81 |
96 |
53 |
154 |
119 |
169 |
85 |
44 |
|
Scenario 7b -Emergency discharge at Spring Tide for 6 hours |
82 |
98 |
52 |
154 |
121 |
170 |
86 |
43 |
|
Scenario 3b - Normal Operation |
74 |
88 |
47 |
150 |
117 |
167 |
81 |
39 |
|
Year 2020 – HATS Stage 2A – Dry Season |
||||||||
|
Scenario 7a - Emergency discharge at Neap Tide for 6 hours |
86 |
76 |
62 |
99 |
73 |
174 |
349 |
5 |
|
Scenario 7a -Emergency discharge at Spring Tide for 6 hours |
86 |
75 |
61 |
100 |
73 |
174 |
350 |
5 |
|
Scenario 3b - Normal Operation |
82 |
71 |
58 |
98 |
71 |
172 |
344 |
4 |
|
Year 2020 – HATS Stage 2A – Dry Season (Sensitivity Test) See Note 2 |
||||||||
|
Scenario 7b - Emergency discharge at Neap Tide for 6 hours |
90 |
80 |
65 |
100 |
75 |
176 |
354 |
5 |
|
Scenario 7b -Emergency discharge at Spring Tide for 6 hours |
91 |
79 |
64 |
103 |
75 |
176 |
355 |
5 |
|
Scenario 3b - Normal Operation |
82 |
71 |
58 |
98 |
71 |
170 |
344 |
4 |
Shaded cell – exceedance of beach water quality objective.
Notes:
1. Values shown in the above table represent the geometric mean model output for a 30-day simulation period.
2. Past emergency discharge records available from various sewage treatment works indicated that the longest period of emergency discharge would be less than 6 hours. Thus, the scenario of emergency discharge for 24 hours is an extremely remote case for the purpose of worst-case assessment only.
5.201 Table 5.48 tabulates the peak E.coli values predicted at three WSD intakes in western Victoria Harbour that could be potentially affected by the undisinfected effluent from HATS during the emergency discharge period.
Table 5.48 Predicted Peak E.coli Levels During Emergency Discharge Period
|
Tide |
Peak Depth-averaged E.coli level (no. per 100 ml) During Emergency Discharge Period |
||
|
WSD18 – Central Water Front
WSD18 |
WSD19 - Sheung Sha Wan |
WSD20 - Kennedy Town F5 |
|
|
WQO: |
20000 at any time |
||
|
Scenario 5a - Year 2009 – HATS ADF Stage - Emergency Discharge for 6 Hours – Wet Season |
|||
|
Neap Tide |
NEG
NEG |
NEG |
NEG
|
|
Spring Tide |
8142
|
10788 |
6876
|
|
Scenario 5b – Year 2009 – HATS ADF Stage - Emergency Discharge for 24 Hours – Wet Season (Sensitivity Test) |
|||
|
Neap Tide |
7854 |
21370 |
2331
|
|
Spring Tide |
15607 |
17789 |
13517
|
|
Scenario 5a - Year 2009 – HATS ADF Stage - Emergency Discharge for 6 Hours – Dry Season |
|||
|
Neap Tide |
NEG |
NEG |
13571
|
|
Spring Tide |
5508 |
7854 |
3540
|
|
Scenario 5b - Year 2009 – HATS ADF Stage – Emergency Discharge for 24 Hours – Dry Season (Sensitivity Test) |
|||
|
Neap Tide |
7151 |
8921 |
21531
|
|
Spring Tide |
10289 |
13578 |
23397
|
|
Scenario 6a - Year 2013 – HATS ADF Stage - Emergency Discharge for 6 Hours – Wet Season |
|||
|
Neap Tide |
NEG |
NEG |
NEG
|
|
Spring Tide |
6643 2446 NEG NEG 3672 NEG NEG 6643 |
9955 |
5331
|
|
Scenario 6b - Year 2013 – HATS ADF Stage - Emergency Discharge for 24 Hours – Wet Season (Sensitivity Test) |
|||
|
Neap Tide |
6341
|
20676 |
1698
|
|
Spring Tide |
12596
|
15624 |
11225
|
|
Scenario 6a - Year 2013 – HATS ADF Stage - Emergency Discharge for 6 Hours – Dry Season |
|||
|
Neap Tide |
NEG
|
NEG |
13947
|
|
Spring Tide |
NEG
|
7718 |
3644
|
|
Scenario 6b - Year 2013 – HATS ADF Stage - Emergency Discharge for 24 Hours – Dry Season (Sensitivity Test) |
|||
|
Neap Tide |
NEG
|
8887 |
21573
|
|
Spring Tide |
10176
|
13579 |
23541
|
|
Scenario 7a - Year 2020 – HATS Stage 2A - Emergency Discharge for 6 Hours – Wet Season |
|||
|
Neap Tide |
NEG
|
NEG |
NEG
|
|
Spring Tide |
4907
|
4933 |
6548
|
|
Scenario 7b - Year 2020 – HATS Stage 2A - Emergency Discharge for 24 Hours – Wet Season (Sensitivity Test) |
|||
|
Neap Tide |
3180
|
5357 |
2190
|
|
Spring Tide |
16887
|
18957 |
14481
|
|
Scenario 7a - Year 2020 – HATS Stage 2A - Emergency Discharge for 6 Hours – Dry Season |
|||
|
Neap Tide |
3735
|
5209 |
20461
|
|
Spring Tide |
2966
|
4066 |
3845
|
|
Scenario 7b - Year 2020 – HATS Stage 2A - Emergency Discharge for 24 Hours – Dry Season (Sensitivity Test) |
|||
|
Neap Tide |
6756
|
7574 |
31843
|
|
Spring Tide |
13150
|
17790 |
33578
|
NEG – The observed elevations are negligible.
Shaded cell – exceedance of WSD standard.
5.202 Under each scenario, modelling was carried out for two emergency discharge cases at the large amplitude spring tide and the small amplitude neap tide respectively. The model runs aimed to capture the extreme conditions in spring tides where the pollutants could be brought to the farther field and in neap tides where there may be larger impacts in the near field. Significant differences in the model results are thus observed between the neap tide case and the spring tide case as shown in Table 5.48.
5.203 The model predicted that the peak E.coli levels at Sheung Wan (WSD19) and Kennedy Town (WSD20) in the western Victoria Harbour would breach the WSD standard of 20000 no. per 100 ml during the emergency discharge under some discharge scenarios. It should be noted that almost all WQO exceedances predicted at WSD19 and WSD20 occurred under the very adverse case of 24-hour discharge of undisinfected effluent with a total discharge volume of over 1.5, 1.6 and 2.3 million m3 for 2009, 2013 and 2020 respectively. Based on past record, the longest period of emergency discharge of untreated effluent at various PTW and STW in Hong Kong would be less than 6 hours. The chance of emergency discharge for more than 6 hours is therefore expected to be very remote. The peak levels predicted at the Kennedy Town (WSD20) would exceed the WSD standard under the emergency discharge of 6 hours. However, it should be highlighted that this predicted peak level only marginally exceeded the standard and the exceedance occurred only at one instant during the emergency discharge period. The predicted impacts on the WSD intakes due to the emergency discharge are therefore considered acceptable.
Temporary Failure of Dechlorination Plant
5.204 The predicted TRC levels under the emergency situation are presented as maximum instantaneous values in Figure 5.42 to Figure 5.47. The contour plots for normal operation scenarios are also included in these figures for comparison. It was found that, during the emergency discharge periods, the predicted maximum TRC values in the receiving water would exceed the assessment criterion of 0.008 mg/l. However, the mixing zones of TRC (within which the maximum TRC values would exceed the assessment criterion) would be limited in areas close to the SCISTW submarine outfall to the south of Tsing Yi Island as shown in Figure 5.42 to Figure 5.47. The sizes of the maximum mixing zones of TRC predicted under different emergency discharge scenarios are given in Table 5.49. It should be hightlighted that the mixing zone dimensions provided in this EIA represent a conservative estimation as they were established based on the maximum values predicted over the entire simulation period.
Table 5.49 Maximum Dimensions of Mixing Zones for TRC under Emergency Situations
|
Stage |
Emergency Discharge Scenarios |
Approximate Dimension of Mixing Zone (m2) |
Figure Reference |
|
|
Dry Season |
Wet Season |
|||
|
2009 – ADF Stage |
8a – Discharge at spring tide for 40 minutes |
1410 x 1880 |
1410 x 1720 |
5.42 and 5.43 |
|
2009 – ADF Stage |
8a – Discharge at neap tide for 40 minutes |
1830 x 1200 |
1490 x 1550 |
5.42 and 5.43 |
|
2013 – ADF Stage |
9a – Discharge at spring tide for 40 minutes |
1430 x 1910 |
1400 x 1780 |
5.44 and 5.45 |
|
2013 – ADF Stage |
9a – Discharge at neap tide for 40 minutes |
1830 x 1300 |
1500 x 1670 |
5.44 and 5.45 |
|
2020 – Stage 2A |
10a – Discharge at spring tide for 60 minutes |
1460 x 1920 |
1420 x 1810 |
5.46 and 5.47 |
|
2020 – Stage 2A |
10a – Discharge at neap tide for 60 minutes |
1860 x 1400 |
1500 x 1680 |
5.46 and 5.47 |
5.205 Based on the chlorine residual of 6.7 mg/l for ADF stage and 5.5 mg/l for Stage 2A and the minimum dilution predicted in Table 5.45, it is calculated that the chlorine concentrations at the edge of ZID would range from 0.14 to 0.15 mg/l which exceeded the TRC criterion of 0.013 mg/l under the emergency situations. However, as shown in Figure 5.42 to Figure 5.47, no observable impact was predicted in the areas farther away from the outfall outside the mixing zones. The maximum values predicted at all the identified sensitive receivers including the Tsuen Wan beaches and Ma Wan FCZ were well below the assessment criterion of 0.008 mg/l under all the emergency situations. The model results indicated that the emergency discharge would not cause any cumulative TRC impact with other concurrent discharges.
5.206 The influence zones of the emergency TRC discharges are predicted to cover only the areas close to the submarine outfall of SCISTW and no observable impact was predicted at all the identified water sensitive receivers. The time series plots of TRC for the periods before, during and after the emergency discharge are presented at two selected indicator points near the SCISTW outfall, in Appendix 5-13 to Appendix 5-16 for 2009. Both indicator points are EPD stations, namely WM3 and VM8 respectively, as shown in Figure 5.1. The predicted results for normal operation are also included in the time series plots for comparison. The time series plots for 2013 and 2020 are similar to that for 2009 and are therefore not presented.
5.207 The time series plots in Appendix 5-13 to Appendix 5-16 showed that the emergency discharge would cause a short-term elevation of TRC. Table 5.50 shows the peak TRC values predicted during the emergency discharge periods at stations WM3 and VM8 under various discharge scenarios. The model results indicated that the baseline water quality conditions would quickly recover (within 2 hours) after the termination of the discharge under all the emergency scenarios. The peak TRC values predicted at the two EPD stations complied well with the assessment criterion.
|
Stage |
Emergency Discharge Scenarios |
Peak TRC Value (mg/l) |
|||
|
Station VM8 |
Station WM3 |
||||
|
Wet Season |
Dry Season |
Wet Season |
Dry Season |
||
|
Assessment Criterion: |
0.008 |
||||
|
2009 – ADF Stage |
8a – Discharge at spring tide for 40 minutes |
NEG |
NEG |
0.0013 |
0.001 |
|
2009 – ADF Stage |
8a – Discharge at neap tide for 40 minutes |
0.0001 |
0.0003 |
0.0005 |
NEG |
|
2013 – ADF Stage |
9a – Discharge at spring tide for 40 minutes |
NEG |
NEG |
0.0014 |
0.001 |
|
2013 – ADF Stage |
9a – Discharge at neap tide for 40 minutes |
0.0001 |
0.0004 |
0.0005 |
NEG |
|
2020 – Stage 2A |
10a – Discharge at spring tide for 60 minutes |
NEG |
NEG |
0.0015 |
0.0012 |
|
2020 – Stage 2A |
10a – Discharge at neap tide for 60 minutes |
0.0001 |
0.0005 |
0.0005 |
NEG |
NEG – The observed elevations are negligible.
5.208 It is considered that the chlorination process could be practically stopped within 30 minutes upon the occurrence of any dechlorination plant failure. The model results indicated that the TRC level would exceed the assessment criterion at the edge of the ZID in the near field. The average size of ZID is given in Section 5.180. It is however expected that the impact on the marine ecology due to the emergency discharge should be limited given that the TRC exceedance would be only localized and temporary (within a few hours). The peak TRC levels predicted at all the identified water sensitive receivers would well comply with the assessment criterion of 0.008 mg/l under various emergency scenarios.
Disinfection Period
5.209 The model results indicated that the gazetted beaches in Tsuen Wan District would be adversely affected by the undisinfected effluent from SCISTW under both bathing and non-bathing seasons. However, the WQO of 180 per 100 ml for bathing beaches is a geometric mean for the bathing season (March to October) only. Therefore, disinfection at SCISTW would only be needed during the bathing seasons to meet the statutory requirement with respect to the WQO for bathing beaches.
5.210 The WQO of 610 E.coli per 100 ml for secondary contact recreation subzones, on the other hand, is an annual geometric mean which covers the periods in both bathing and non-bathing seasons. In addition, the WSD standard of 20,000 E.coli per 100 ml for flushing water intakes is a criterion that should be met at all times during the year. The model predicted that the beneficial uses of the secondary contact recreation subzones in Tsuen Wan coast and the WSD flushing water intakes in western Victoria Harbour would be adversely affected by the undisinfected SCISTW effluent under both bathing and non-bathing seasons. It is therefore recommended that year-round disinfection should be provided for the SCISTW effluent to protect the secondardy contact recreation subzones and the WSD flushing water intakes. Year-round disinfection would also be required to minimize the human health risk if the Tsuen Wan beaches are to be opened at all times during the year.
5.211 The SCISTW outfall is situated between the Tsuen Wan coast and the western HK Island. Under the flood conditions, the undisinfected SCISTW effluent would be brought to the Tsuen Wan coast by the water current flowing from south to north affecting the Tsuen Wan beaches. During the ebb tides, the SCISTW effluent would be brought towards the coast of western HK Island influencing the nearby WSD flushing water intakes. Temporary discharge of undisinfected effluent from SCISTW for 6 hours and 24 hours was modelled under different seasonal and tidal conditions as shown in Appendix 5-9 to Appendix 5-12. The model predicted that the E.coli levels at the Tsuen Wan beaches and the WSD flushing water intakes would be sensitive to the temporary discharge of undisinfected effluent from SCISTW. Appendix 5-9 to Appendix 5-12 showed that, depends on the tide status when the temperary discharge starts, the E.coli levels at some sensitive receivers under some situations would be elevated quite significantly immediately (within a hour) after the start of the temporary discharge. Temporary discharge of undisinfected HATS effluent for less than 6 hours was not further considered. It is suggested that continuous disinfection throughout the year would be needed to protect the sensitive receivers and minimize the human health risk to the beach users. Intermittent disinfection is therefore not recommended.
Mitigation of Adverse Environmental Impacts
Construction Phase
Construction Site Runoff and General Construction Activities
5.212 To minimise the potential water quality impacts from construction site runoff and various construction activities, the practices outlined in ProPECC PN 1/94 Construction Site Drainage should be adopted. A copy of the ProPECC PN 1/94 is attached in Appendix 5-17 for reference. It is recommended to install perimeter channels in the works areas to intercept runoff at site boundary prior to the commencement of any earthwork. To prevent storm runoff from washing across exposed soil surfaces, intercepting channels should be provided. Drainage channels are also required to convey site runoff to sand/silt traps and oil interceptors. Provision of regular cleaning and maintenance can ensure the normal operation of these facilities throughout the construction period. Any practical options for the diversion and re-alignment of drainage should comply with both engineering and environmental requirements in order to ensure adequate hydraulic capacity of all drains.
5.213 There is a need to apply to EPD for a discharge licence under the WPCO for discharging effluent from the construction site. The discharge quality is required to meet the requirements specified in the discharge licence. All the runoff and wastewater generated from the works areas should be treated so that it satisfies all the standards listed in the TM-DSS. The beneficial uses of the treated effluent for other on-site activities such as dust suppression, wheel washing and general cleaning etc., can minimise water consumption and reduce the effluent discharge volume. It is anticipated that the wastewater generated from the works areas would be of small quantity. If monitoring of the treated effluent quality from the works areas is required during the construction phase of the Project, the monitoring should be carried out in accordance with the WPCO license which is under the ambit of regional office (RO) of EPD.
5.214 The construction programme should be properly planned to minimise soil excavation, if any, in rainy seasons. This prevents soil erosion from exposed soil surfaces. Any exposed soil surfaces should also be properly protected to minimise dust emission. In areas where a large amount of exposed soils exist, earth bunds or sand bags should be provided. Exposed stockpiles should be covered with tarpaulin or impervious sheets at all times. The stockpiles of materials should be placed at locations away from any stream courses so as to avoid releasing materials into the water bodies. Final surfaces of earthworks should be compacted and protected by permanent work. It is suggested that haul roads should be paved with concrete and the temporary access roads protected using crushed stone or gravel, wherever practicable. Wheel washing facilities should be provided at all site exits to ensure that earth, mud and debris would not be carried out of the works areas by vehicles.
5.215 Good site practices should be adopted to clean up / collect the rubbish and litter on the construction sites so as to prevent the rubbish and litter from spreading from the site area. It is recommended to clean the construction sites on a regular basis.
Sewage from Workforce
5.216 The presence of construction workers generates sewage. It is recommended to provide sufficient chemical toilets in the works areas. The toilet facilities should be more than 30 m from any watercourse. A licensed waste collector should be deployed to clean the chemical toilets on a regular basis. The construction workers can also make use of the existing toilet facilities within the SCISTW as necessary.
5.217 Notices should be posted at conspicuous locations to remind the workers not to discharge any sewage or wastewater into the nearby environment during the construction phase of the project. Regular environmental audit on the construction site can provide an effective control of any malpractices and can achieve continual improvement of environmental performance on site. It is anticipated that sewage generation during the construction phase of the project would not cause water pollution problem after undertaking all required measures.
Accidental Spillage of Chemicals
5.218 Contractors must register as a chemical waste producer if chemical wastes would be produced from the construction activities. The Waste Disposal Ordinance (Cap 354) and its subsidiary regulations in particular the Waste Disposal (Chemical Waste) (General) Regulation should be observed and complied with for control of chemical wastes.
5.219 Any service shop and maintenance facilities should be located on hard standings within a bunded area, and sumps and oil interceptors should be provided. Maintenance of vehicles and equipment involving activities with potential for leakage and spillage should only be undertaken within the areas appropriately equipped to control these discharges.
5.220 Disposal of chemical wastes should be carried out in compliance with the Waste Disposal Ordinance. The Code of Practice on the Packaging, Labelling and Storage of Chemical Wastes published under the Waste Disposal Ordinance details the requirements to deal with chemical wastes. General requirements are given as follows:
· Suitable containers should be used to hold the chemical wastes to avoid leakage or spillage during storage, handling and transport.
· Chemical waste containers should be suitably labeled, to notify and warn the personnel who are handling the wastes, to avoid accidents.
· Storage area should be selected at a safe location on site and adequate space should be allocated to the storage area.
Operation Phase
5.221 An operational phase environmental monitoring programme would be recommended in the EM&A Manual to confirm the predictions of the environmental impacts made in the EIA report. Effluent quality from the SCISTW will be governed by the Water Pollution Control Ordinance and the associated discharge licence conditions. The dosing system is designed to allow adjustment for compliance of the effluent standards as well as minimization of the chlorine dosage, thus, the potential generation of chlorination by-products.
5.222 The modelling results indicated that the residual E.coli predicted at the Tsuen Wan beaches (after the Project is commissioned at 2009) would be partly caused by the local pollution sources in the rural areas of Sham Tseng, and the polluted waters in Rambler Channel due to the expedient connections, misconnections and polluted surface runoff from the dense urban areas in Tsuen Wan, Kwai Chung and Tsing Yi Districts. It is noted that Government has also put in place local sewerage improvement projects, in conjunction with the provision of disinfection facilities at SCISTW, to tackle the local pollution problems in Sham Tseng, Tsuen Wan, Kwai Chung, and Tsing Yi District so as to rectify these local problems.
5.223 In case of power outage, the uninterruptible power supply (UPS) system will switch the power supply of the sodium bisulphite dosing pump to a backup battery almost instantaneously, allowing continuous dosage of sodium bisulphite for at least half an hour so that sufficient time can be provided for shutting down the chlorination plant to avoid the possibility of discharge of chlorinated effluent. With proper implementation of these mitigation measures, the occurrence of discharge of non-dechlorinated effluent would be very remote. In case that the dechlorination process fails, the chlorination process could be practically stopped within 30 minutes to avoid discharge of TRC into the marine water. The E.coli impact due to no chlorination for a short period of time would be temporary and acceptable as supported by the water quality impact assessment results.
5.224 The bacterial levels at the beaches, the Ma Wan FCZ and the secondary contact recreation subzones in Tsuen Wan District, as well as the WSD flushing water intakes in western Victoria Harbour could be elevated in the event of temporary discharge of undisinfected effluent from SCISTW during chlorination plant failure or when the chlorination plant is closed in the event of dechlorination plant failure. Under the emergency discharge, the beaches and the secondary contact subzones in Tsuen Wan District should be closed. It is recommended that relevant government departments including EPD and LCSD should be informed by DSD as soon as possible of any emergency discharge so that appropriate actions can be taken. A list of address, email address, phone and fax number of key persons in relevant departments responsible for action should be made available to the plant operators. Water quality monitoring should be carried out at such a time to quantify the water quality impacts and to determine when the baseline water quality conditions are restored.
5.225 To provide a mechanism to minimise the impact of emergency discharges, a framework of the emergency response procedures in case of chlorination / dechlorination plant failure has been formulated and are given in a standalone EM&A Manual.
Construction Phase
5.226 The construction phase water quality impact, if any, would generally be temporary and localised during construction. No unacceptable residual water quality impacts would be expected during the construction phase of the Project, provided that all the recommended mitigation measures are properly implemented.
Operation Phase
5.227 The Project would result in beneficial effect as the E.coli Levels in the receiving water bodies would be significantly reduced due to the provision of disinfection facilities at SCISTW. The model results indicated that adverse water quality impact due to the discharge of TRC and CBP associated with chlorination of the Project effluent is not expected. The model predicted that the water quality impact in terms of the TRC and CBP levels at all the identified water sensitive receivers would be acceptable after commissioning of the Project.
5.228 The water quality impact due to the emergency discharges is expected to be short-term. In case of dechlorination plant failure, the TRC level would exceed the assessment criterion at the edge of the ZID in the near field based on the model results. It is however expected that the associated impact on marine ecology should be limited given that the TRC exceedance would be only localized and temporary (within a few hours). In case of power outage, the uninterruptible power supply (UPS) system will switch the power supply of the sodium bisulphite dosing pump to a backup battery almost instantaneously, allowing continuous dosage of sodium bisulphite for at least half an hour so that sufficient time can be provided for shutting down the chlorination plant to avoid the possibility of discharge of chlorinated effluent. Also, a framework of the emergency response procedures has been formulated to minimise the impact of emergency discharges. No insurmountable water quality impact is expected from these temporary discharges provided that all the recommended mitigation measures are properly implemented.
Environmental Monitoring and Audit
5.229 Effluent quality from the SCISTW will be governed by the Water Pollution Control Ordinance and the associated discharge licence conditions. An operational phase environmental monitoring programme is recommended for the ADF stage to confirm the predictions of the environmental impacts made in the EIA report. Marine water quality monitoring is also recommended during and after any emergency discharge of undisinfected HATS effluent under the ADF stage. Details are given in the separate EM&A Manual as part of the EIA study. Detailed monitoring programme for HATS Stage 2A will be developed under a separate EIA study.
Construction Phase Impact
5.230 Minor water quality impact, if any, would be associated with land-based construction. Impacts may result from the surface runoff and sewage from on-site construction workers. Impacts could be controlled to comply with the Water Pollution Control Ordinance (WPCO) standards by implementing the recommended mitigation measures. Unacceptable residual impacts on water quality would not be expected.
Operation Phase Impact
5.231 Chlorination is proposed as the disinfection technology for the Stonecutters Island Sewage Treatment Works (SCISTW) which would however generate total residual chlorine (TRC) and chlorination by-products (CBP) in the Project effluent. Dechlorination will be applied to eliminate the discharge of TRC into the marine environment. An assessment of water quality impact due to the operation of the Project was made using the Delft3D model. Impacts were assessed over a series of 30-day simulation periods.
Normal Operation
Proposed Effluent Standards
5.232 The model results indicated that the provision of disinfection facilities at SCISTW would be needed to satisfy the requirement for protection of the identified water sensitive receivers and help to improve water quality in the Western Buffer water control zone (WCZ) and western Victoria Harbour.
5.233 Sensitivity model runs were performed to estimate the optimum disinfection levels and durations for the disinfection facilities, on one hand, to safeguard the beneficial uses of nearby water sensitive receivers and, on the other hand, to minimize the chlorine dose and thus the potential generation of CBP.
5.234 The model results indicated that the gazetted beaches in Tsuen Wan District would be adversely affected by the undisinfected effluent from SCISTW under both bathing and non-bathing seasons. However, the WQO of 180 per 100 ml for bathing beaches is a geometric mean for the bathing season (March to October) only. Therefore, disinfection at SCISTW would only be needed during the bathing seasons to meet the statutory requirement with respect to the WQO for bathing beaches.
5.235 The WQO of 610 E.coli per 100 ml for secondary contact recreation subzones, on the other hand, is an annual geometric mean which covers the periods in both bathing and non-bathing seasons. In addition, the WSD standard of 20,000 E.coli per 100 ml for flushing water intakes is a criterion that should be met at all times during the year. The model predicted that the beneficial uses of the secondary contact recreation subzones in Tsuen Wan coast and the WSD flushing water intakes in western Victoria Harbour would be adversely affected by the undisinfected SCISTW effluent under both bathing and non-bathing seasons. It is therefore recommended that year-round disinfection should be provided for the SCISTW effluent to protect the secondardy contact recreation subzones and the WSD flushing water intakes. Year-round disinfection would also be required to minimize the human health risk if the Tsuen Wan beaches are to be opened at all times during the year.
5.236 Based on the water quality modelling results, discharge standards are recommended for the SCISTW effluent after the Project commissioned as shown in Table 5.51. The advance disinfection facilities (ADF) and the permanent disinfection facilities under Stage 2A would be designed to cater for the recommended disinfection levels. Allowances would be provided in the design with capacities higher than those required for the recommended operational range. An operation plan has been developed for the chemical dosing. The dosing system would be designed to allow adjustment for compliance with the effluent standards. Monitoring of effluent quality is recommended for operational stage and under the perspective of the WPCO.
Table 5.51 Recommended Effluent Standards for the HATS
|
Stage |
Operation Range of Chlorine Dosage (mg/l) |
E.coli (no. per 100 ml) |
TRC (mg/l) |
||
|
Geometric Mean |
95 Percentile |
95 Percentile |
Maximum |
||
|
HATS – ADF Stage |
11-15 |
200,000 |
3,000,000 |
0.2 |
0.4 |
|
HATS – Stage 2A |
10-14 |
20,000 |
300,000 |
0.2 |
0.4 |
|
HATS – Stage 2B |
2-3 |
20,000 |
300,000 |
0.2 |
0.4 |
5.237 The water quality model results showed that, with the adoption of effluent standards (which are equivalent to 99% or above E. coli removal) recommended in Table 5.51, the discharge of HATS effluent after chlorination and dechlorination would be unlikely to cause adverse water quality impact. Although the model input parameters were conservative, the model predicted that the disinfected HATS effluent would not cause any non-compliance with the marine water quality criteria as shown in Table 5.52.
Table 5.52 Marine Water Quality Criteria Adopted in the Water Quality Impact Assessment
|
Parameter |
Assessment Criteria |
Applicable Zones / Uses |
|
|
E.coli |
≤180 per 100 ml |
Geometric mean for the period from March to October |
Bathing beach subzones only |
|
≤ 610 per 100 ml |
Annual geometric mean |
Secondary contact recreation subzones and fish culture subzones only |
|
|
≤ 20000 per 100 ml |
Maximum value |
WSD flushing water intakes only |
|
|
Total residual chlorine (TRC) |
≤ 0.008 mg/l |
Daily maximum |
All WCZ of concern |
|
≤ 0.013 mg/l |
Daily maximum |
At edge of initial dilution zones |
|
Environmental Benefits of the Project
Marine Water Quality
5.238 The Project would result in beneficial effect as the bacteria levels in the receiving marine water bodies would be significantly reduced due to the provision of disinfection facilities at SCISTW. The Project would bring significant water quality improvements at the water sensitive receivers identified within the Study Area including the beaches, the fish culture zones (FCZ) and the secondary contact recreation subzones in Tsuen Wan coast as well as the seawater intakes in western Victoria Harbour. The model predicted that the bacteria levels in the Western Buffer WCZ, western Victoria Harbour and eastern part of the North Western WCZ would be significantly reduced upon commissioning of the Project.
Beach Water Quality
5.239 The model results revealed that considering the contribution from the undisinfected HATS effluent alone, the mean E.coli levels predicted at the bathing beaches in Tsuen Wan District could range from 88 to 817 no. per 100 ml during Stage 1 and Stage 2A as compared to the water quality objective (WQO) of 180 no. per 100 ml. The proposed disinfection facilities (including the ADF) at SCISTW are found to be capable of almost eliminating the HATS E.coli loading to the beaches. The geometric mean HATS contributions predicted at the bathing beaches would be reduced to ≤15 count per 100mL after provision of the ADF. These contributions are considered small when compared to the WQO of 180 E.coli per 100mL. From this perspective, the Project could facilitate the reopening of those closed beaches at Tsuen Wan and minimize the human health risk to the beach users.
Re-opening of Tsuen Wan Beaches
5.240 The Leisure and Cultural Services Department (LCSD) is currently the “beach management authority”, responsible for determining the opening and closing of gazetted beaches. The decision is made with reference to the advice provided by EPD on the suitability of beach water quality for bathing purposes and the consideration of all other factors. Generally, a beach will be closed if it is ranked "Very Poor" repeatedly. Beaches having annual geometric mean E.coli densities greater than 610 per 100mL are ranked "Very Poor”.
5.241 The procedures for re-opening a beach will involve the following key steps:
1.1
· EPD informs LCSD of continued water quality improvement at the concerned beach and that the beach is suitable for swimming. In making this advice, EPD normally refers to beach water quality monitoring results that it has collected over a sufficiently long period (typically at least one year).
· LCSD then clarifies the actual situation with EPD, and decides whether and when to re-open the affected beach.
· Once a decision on beach re-opening is made, LCSD will issue a press release and inform the relevant District Council.
5.242 The monitoring data shows that both the HATS Stage 1 un-disinfected effluent discharge and local pollution sources are contributing to the poor or very poor beach water quality at the seven Tsuen Wan beaches. Before the beach management authority may consider re-opening any of these beaches, it is necessary to improve beach water quality to a level consistent with the present policy on beach management and community aspirations.
5.243 The ADF, together with reduction of localised un-treated wastewater discharges being implemented under the regional sewerage schemes, will be essential to improving the Tsuen Wan beach water quality and, consequently, re-opening of the beaches. From the historic records as shown in Exhibit 2.2, three beaches, namely Anglers’, Ting Kau and Approach, on the Tsuen Wan coast had been closed due to strong influence of local pollution sources before the commissioning of HATS Stage 1. On top of the already poor water quality, un-disinfected effluent from HATS Stage 1 commissioned in late 2001 has caused four other beaches on the coast to close. They are, namely Lido, Casam, Hoi Mei Wan, and Gemini.
5.244 Based on the water quality modelling results, provision of disinfection facilities at SCISTW after implementation of ADF will keep the influence of the HATS effluent at the Tsuen Wan Beaches to a very low level (≤ 15 E. coli per 100 ml). With regard to the background (i.e., non-HATS) pollution sources, the government has been implementing the local sewerage works along Castle Peak Road for completion by 2009 in conjunction with the ADF to serve the unsewered villages and properties around Ting Kau, Sham Tseng and Tsing Lung Tau. As the outfalls of Kwai Chung, Tsing Yi and Northwest Kowloon PTWs (which should have an influence on the water quality of Tsuen Wan beaches at the pre-HATS stage) have been decommissioned since the commissioning of HATS Stage 1 in 2001, it is expected that the beach water quality after the operation of the ADF would be improved to a level that is better than the pre-HATS Stage 1 condition to facilitate early re-opening of the Tsuen Wan beaches.
5.245 Without disinfecting the HATS Stage 1 effluent, the Tsuen Wan beach water quality cannot be restored even with the completion of local sewerage works which can only arrest the local pollution problems. The proposed ADF, in conjunction with the local sewerage works being implemented, will bring about the necessary water quality improvements needed for the re-opening of Tsuen Wan beaches at the earliest possible moment. If the ADF were not implemented, the Tsuen Wan beach water quality would remain jeopardised by the un-disinfected HATS Stage 1 effluent, until the permanent disinfection facilities proposed under Stage 2A are commissioned. The current timetable for HATS Stage 2A is for substantial completion to be achieved by end 2014. This is about five years behind the target commissioning date of end 2009 for completing the ADF.
5.246 In conclusion, the provision of the proposed ADF is an integral part of the sewerage programme to restore the water quality of the Tsuen Wan beaches at the earliest possible moment. The E. coli levels at the Tsuen Wan beaches during the ADF stage have been quantified by using mathematical model. As the model input data such as the HATS flow rates and the background pollution loading tended to be conservative to provide a margin of tolerance (refer to Section 5.65 and Appendix 5.2), it is likely that the actual E. coli levels at the beaches could be lower than that predicted in this EIA. This will be ascertained by monitoring of the actual beach water quality. Once the actual monitoring results confirm that the beach water quality has returned to an acceptable level for swimming, arrangements to re-open the beaches for public enjoyment will be instigated.
Provision of Disinfection for HATS Stage 2B
5.247 Regarding Stage 2B, the EIA water quality modelling results showed that with the implementation of biological treatment, compliance with the relevant WQO at most of the beaches without the provision of disinfection should be achievable. However, it is important to note that modelling cannot fully predict the high variability of some factors (e.g. salinity, natural ultra violet radiation, and wind) that affect the density of E. coli in the receiving waters. Therefore, planning for disinfection in Stage 2B is recommended, though this provision may be reviewed in the light of actual water quality monitoring results after commissioning of the ADF.
Chlorination By-products (CBP) and Effluent Toxicity
5.248 Chlorination would generate total residual chlorine (TRC) and chlorination by-products (CBPs) in the effluent. Dechlorination would eliminate the discharge of TRC into the marine environment. As for CBPs, laboratory tests were carried out on 34 CBP’s (including trihalomethane (THM) and haloacetic acid (HAA)) in the CEPT effluent before and after chlorination/dechlorination. Of these 34 CBP’s, only 8 were detected in the CEPT after chlorination and dechlorination, the concentrations of 6 were less than 10 parts per billion while those for the remaining 2 were in the 10-50 parts per billion range. However, 5 of these 8 CBPs were also detected in the raw CEPT effluent before chlorination and dechlorination. Of these 5, the concentrations of 3 were less than 10 parts per billion while the remaining two had concentrations in the 10-50 parts per billion range. These results indicated that of the few CBP’s detected, the majority was already present in the raw CEPT effluent, and the chlorination and dechlorination process introduced 3 CBP’s all showing concentrations of less than 10 parts per billion. The laboratory results also showed that the THM and HAA formed were in the parts per billion concentration range, well below USEPA’s drinking water standard for THM and HAA.
5.249 Water quality modelling results showed that the discharge of effluent after chlorination and dechlorination would not cause adverse water quality impact. Although the model input parameters were conservative, water quality modelling results suggested that the maximum TRC and CBPs levels in the receiving waters would comply well with the assessment criteria during normal operation of the SCISTW after commissioning of the Project.
5.250 Results of whole effluent toxicity test on C/D HATS effluent were used to determine whether the C/D effluent would induce adverse effects to marine life. It was found that the established toxicity criteria were complied at both edge of zone of initial dilution (ZID) and edge of mixing zone under all the assessment scenarios. Therefore, the potential toxicity impacts from the Project effluent on marine life were expected to be acceptable.
Emergency Situations
5.251 The discharge of chlorinated effluent (without dechlorination) under the event of dechlorination plant failure has been modelled for various discharge durations and scenarios. The model predicted that, during the emergency discharge periods, the TRC levels near the SCISTW outfall would be elevated and the TRC levels would exceed the assessment criterion in the near field during the emergency discharge period. Since the impact zones for the emergency TRC discharge are predicted to be localized (close to the SCISTW outfall) and temporary (within a few hours), the associated water quality and ecological impacts should be limited. The model results indicated that the maximum TRC levels predicted at all the identified water and ecological sensitive receivers would comply well with the assessment criterion under the emergency situations.
5.252 In case of power outage, the uninterruptible power supply (UPS) system will switch the power supply of the sodium bisulphite dosing pump to a backup battery almost instantaneously, allowing continuous dosage of sodium bisulphite for at least half an hour so that sufficient time can be provided for shutting down the chlorination plant to avoid the possibility of discharge of chlorinated effluent.
5.253 The model predicted that the bacteria levels at the gazetted beaches, the (FCZ and the secondary contact recreation subzones in Tsuen Wan coastal waters, and the WSD flushing water intakes in western Victoria Harbour would be elevated due to the emergency release of undisinfected effluent at the SCISTW outfall during ADF stage and Stage 2A, but impacts are expected to be short-term. In the event of emergency discharge of undisinfected effluent, the Plant operators of SCISTW should inform EPD and LCSD as soon as possible so that appropriate actions can be taken. A list of address, email address, phone and fax number of key persons in relevant departments responsible for action should be made available to the plant operators. Water quality monitoring should be carried out to quantify the water quality impacts and to determine when the normal water quality conditions are recovered. In view of the temporary nature of the emergency discharge, no insurmountable water quality impact is expected, provided that all the recommended mitigation measures are properly implemented.