4.2 Legislation,
Standards, Guidelines and Criteria
4.4 Description
of the Environment
4.5 Consideration
of Concurrent Projects
4.6 Identification of Potential Impacts
4.8 Evaluation
of Potential Impacts – Construction Phase
4.9 Evaluation
of Potential Impacts – Operational Phase (Project Effluent Discharge)
4.10 Evaluation
of Potential Impacts – Operational Phase (Other Water Pollution Sources)
4.11 Mitigation
Measures – Construction Phase
4.12 Mitigation
Measures – Operational Phase
4.13 Evaluation
of Cumulative Impacts
4.14 Residual
Water Quality Impacts
4.15 Environmental
Monitoring and Audit (EM&A) Requirements
List of TABLES
Table 4.1.... Water Quality Objectives for
Tolo Harbour and Channel WCZ
Table 4.2.... Water
Quality Objectives for Victoria Harbour (Phases One, Two and Three) WCZs
Table 4.3.... WSD’s
Target Seawater Quality Objectives at Flushing Water Intakes
Table 4.4.... Water
Quality Objectives at Seawater Intake of Marine Science Laboratory of CUHK
Table 4.5.... Water
Quality Criteria for Fish Culture Zones
Table 4.6.... Baseline
Water Quality Condition for Victoria Harbour WCZ in 2020
Table 4.7.... Baseline
Water Quality Condition for Tolo Harbour and Channel WCZ in 2020
Table 4.8.... Effluent
Standards of Existing TPSTW and Proposed Project
Table 4.9.... Reclaimed
Water Requirements – WSD Water Quality Objectives
Table 4.10. TPSTW
Discharge (2018 – 2020)
Table 4.11. Typical
Dry Weather Diurnal Flow Pattern of TPSTW in 2018
Table 4.12. Estimated
Overflow Quantities under Normal Operation
Table 4.13. Proposed
Water Quality Modelling Scenarios
Table 4.14. Projects
Affecting Coastline Configurations
Table 4.15. Projects
Affecting Bathymetry
Table 4.16. Predicted
Water Quality at Selected WSD Flushing Water Intakes
Table 4.17. Predicted
Water Quality at Cooling Water Intakes. 4-
List of ExhibitS
Exhibit 4.1 Daily
Flow Record of TPSTW in 2018
Exhibit 4.2 Surplus Flow of TPSTW in 2018
Exhibit 4.3 Surplus Flow of TPSTW in 2019
Exhibit 4.4 Surplus Flow of TPSTW in 2020
Exhibit 4.5 Projected Daily Discharge Rate of TPSTW –
Baseline “Do-nothing” Scenario
Exhibit 4.6 Projected Hourly Overflow at Ultimate Design
Stage
List of FIGURES
Figure 4.1 Layout of Tolo Harbour Effluent Export Scheme
Figure 4.2 Location of Existing Emergency Outfall
Figure 4.3 Water Sensitive Receivers in Victoria Harbour
Figure 4.4 Water Sensitive Receivers in Tolo Harbour and Tolo Channel
Figure 4.5 Water Bodies near the Project site
Figure 4.6 Proposed Interception and Pumping Scheme
List of Appendices
Appendix 4.1 Correspondences from Intake Operators
Appendix 4.2A THMB Model Grid Layout and Coverage
Appendix 4.2B VH Model Grid Layout and Coverage
Appendix 4.3 Contour Plots of Water Quality Modelling Results for Victoria Harbour
Appendix 4.4 Contour Plots of Water Quality Modelling Results for Tolo Harbour and Tolo Channel
Appendix 4.5 Water Quality Modelling Results for Water Sensitive Receivers in Tolo Harbour and Tolo Channel
Appendix 4.6 Time Series Plots of Water Quality Modelling Results for THEES Maintenance Discharge
Appendix 4.7 Comparison of Historical Red Tide and Chlorophyll-a Data Before, During and After Past THEES Maintenance Discharge
Appendix 4.8 Time Series Plots of Water Quality Modelling Results for Emergency Discharge
Appendix 4.9 DSD’s Existing Contingency Plan for Incidents Possibly Encountered in Sewage Treatment Facilities
4
Water Quality Impact
4.1
Introduction
4.1.1 This section presents the findings of the assessment of potential water quality impacts associated with the construction and operation of the Project. Suitable mitigation measures have been recommended to minimize the potential adverse impacts and to ensure the acceptability of any residual impact after mitigation.
4.1.2 Under the existing Tolo Harbour Effluent Export Scheme (THEES), the treated effluent from Tai Po Sewage Treatment Works (TPSTW) is collected in the Tai Po Effluent Pumping Station (TPEPS) and then pumped via a rising main and a submarine pipeline to the existing Sha Tin Effluent Pumping Station (STEPS). The STEPS receives the treated effluent from both TPSTW and Sha Tin Sewage Treatment Works (STSTW) and then pumps the combined effluents to the Sha Tin Portal of the Effluent Export Tunnel of THEES at Ah Kung Kok, which then conveys the effluents to Kai Tak River for discharge into the Kai Tak Approach Channel (KTAC) in Victoria Harbour. In addition, effluent from TPSTW may be discharged via the existing emergency outfall into Tolo Harbour under emergency condition or during the THEES maintenance period. The general layout of the THEES is shown in Figure 4.1. The location of the existing emergency outfall is indicatively shown in Figure 4.2. As such, the Project would have potential impact on both Victoria Harbour and Tolo Harbour.
4.2
Legislation,
Standards, Guidelines and Criteria
Environmental
Impact Assessment Ordinance
4.2.1 The Technical Memorandum on EIA Process (EIAO-TM) was issued by EPD under Section 16 of the EIAO. It specifies the assessment method and criteria that are to be followed in an EIA Study. Reference sections in the EIAO-TM provide the details of assessment criteria and guidelines that are relevant to the water quality impact assessment, including:
n
Annex 6 – Criteria for Evaluating Water Pollution; and
n
Annex 14 – Guidelines for Assessment of Water Pollution
Water Quality Objectives
4.2.2 The Water Pollution Control Ordinance (WPCO) provides major statutory framework for the protection and control of water quality in Hong Kong. According to the Ordinance and its subsidiary legislation, Hong Kong waters are divided into ten Water Control Zones (WCZs). Corresponding statements of Water Quality Objectives (WQOs) are stipulated for different water regimes (marine waters, inland waters, bathing beaches subzones, secondary contact recreation subzones and fish culture subzones) in the WCZs based on their beneficial uses.
4.2.3 The Project site is located in the Tolo Harbour and Channel WCZ. Under normal operation, the existing TPSTW effluent is discharged to the Victoria Harbour (Phase Two) WCZ via the THEES. The Victoria Harbour WCZ has been divided into three phases (namely Phases One, Two and Three respectively) and the associated marine WQOs for all the three phases as defined under the WPCO are the same. WQOs for the Tolo Harbour and Channel WCZ and Victoria Harbour (Phases One, Two and Three) WCZ are listed in Table 4.1 and Table 4.2 respectively.
Table 4.1 Water Quality Objectives for Tolo Harbour
and Channel WCZ
|
Parameters |
Objectives |
Sub-Zone |
|
Offensive odour, tints |
Not
to be present |
Whole zone |
|
Visible foam, oil scum, litter |
Not
to be present |
Whole zone |
|
Colour |
Should
not cause the colour of waters of the subzone to exceed 50 Hazen units at any
time. |
Inland Waters in Shing Mun (A, C, D,
E, H, I), Tai Po (B, C) subzones and other watercourses |
|
Should
not cause the colour of waters of the subzone to exceed 30 Hazen units at any
time. |
Inland Waters in Shing Mun (B, F,
G), Lam Tsuen (C, D), Tai Po (A)subzones |
|
|
Dissolved oxygen (DO) |
Not
less than 2mg/L within two metres of the bottom, or not less than 4mg/L in
the remainder of the water column |
Marine Waters in Harbour Subzone |
|
Not
less than 3mg/L within two metres of the bottom, or not less than 4mg/L in
the remainder of the water column |
Marine Waters in Buffer Subzone |
|
|
Not
less than 4mg/L at any point in the water column |
Marine Waters in Channel Subzone |
|
|
Not
less than 4 mg/L or 40% saturation (at 150C) at any time |
Inland Waters |
|
|
pH |
Not
to cause the normal pH range to be extended by more than ±0.5 pH units at any
time. |
Marine Waters in Harbour Subzone |
|
Not
to cause the normal pH range to be extended by more than ±0.3 pH units at any
time. |
Marine Waters in Buffer Subzone |
|
|
Not
to cause the normal pH range to be extended by more than ±0.1 pH units at any
time. |
Marine Waters in Channel Subzone |
|
|
Not
exceed the normal pH range of 6.5 – 8.5 at any time |
Inland Waters in Shing Mun (A, B, C,
F, G, H), Lam Tsuen (C, D) and Tai Po (A, B, C) subzones |
|
|
Not
exceed the normal pH range of 6.0 – 9.0 at any time |
Inland Waters in Shing Mun (D, E, I)
subzones and other watercourses |
|
|
Light Penetration |
Should
not reduce light transmission by more than 20% of the normal level at any
location or any time. |
Marine Waters in Harbour Subzone |
|
Should
not reduce light transmission by more than 15% of the normal level at any location
or any time. |
Marine Waters in Buffer Subzone |
|
|
Should
not reduce light transmission by more than 10% of the normal level at any
location or any time. |
Marine Waters in Channel Subzone |
|
|
Salinity |
Not
to cause the normal salinity range to be extended by more than ±3 parts per
thousand at any time. |
Marine Waters |
|
Temperature |
Not
to cause the natural daily temperature range to be extended by greater than
±1.0 °C at any location or time. The rate
of temperature change shall not exceed 0.5 °C per hour at any location,
unless due to natural phenomena. |
Marine Waters |
|
Not
to cause the natural daily temperature range to be extended by greater than
±2.0 °C at any location or time. |
Inland Waters |
|
|
Chemical oxygen
demand (COD) |
Not
exceed 15 mg/L at any time |
Inland Waters in Shing Mun (B, F,
G), Lam Tsuen (C, D) and Tai Po (A) subzones |
|
Not
exceed 30 mg/L at any time |
Inland Waters in Shing Mun (A, C, D,
E, H, I), Tai Po (B, C) subzones and other watercourses |
|
|
5-day biochemical
oxygen demand (BOD5) |
Not
exceed 3 mg/L at any time |
Inland Waters in Shing Mun (B, F,
G), Lam Tsuen (C, D) and Tai Po (A) subzones |
|
Not
exceed 5 mg/L at any time |
Inland Waters in Shing Mun (A, C, D,
E, H, I), Tai Po (B, C) subzones and other watercourses |
|
|
Suspended solids (SS) |
Not
to cause the annual median level to exceed 20 mg/L. |
Inland Waters in Shing Mun (A, B, C,
F, G, H), Lam Tsuen (C, D) and Tai Po (A, B, C) subzones |
|
Not
to cause the annual median level to exceed 25 mg/L. |
Inland Waters in Shing Mun (D, E, I)
subzones and other watercourses |
|
|
Settleable Material |
Bottom
deposits or submerged objects should not adversely influence bottom-living
communities, alter the basic Harbour geometry or shipping channels, present
any hazard to shipping or diving activities, or affect any other beneficial
use of the waters. |
Whole zone |
|
Ammonia Nitrogen (NH3-N) |
Not
to exceed 0.5 mg/L at any time |
Inland Waters |
|
E.
coli
Bacteria |
Not
exceed 610 per 100mL, calculated as the geometric mean of all samples
collected in one calendar year |
Secondary Contact Recreation Subzone
and Fish Culture Subzones |
|
Not
exceed 1000 per 100mL, calculated as a running median of the most recent 5
consecutive samples taken at intervals of between 7 and 21 days (or 14 and 42
days) |
Inland Waters in Shing Mun (A, C, D,
E, H, I) and Tai Po (B, C) subzones and other watercourses |
|
|
Not
exceed 0 per 100mL, calculated as a running median of the most recent 5
consecutive samples taken at intervals of between 7 and 21 days (or 14 and 42
days) |
Inland Waters in Shing Mun (B, F,
G), Lam Tsuen (C, D) and Tai Po (A) subzones |
|
|
Chlorophyll-a |
Not
to cause the level of chlorophyll-a
in waters of the subzone to exceed 20 mg/m3, calculated as a
running arithmetic mean of 5 daily measurements for any single location and
depth. |
Marine Waters in Harbour Subzone |
|
Not
to cause the level of chlorophyll-a
in waters of the subzone to exceed 10 mg/m3, calculated as a
running arithmetic mean of 5 daily measurements for any single location and
depth. |
Marine Waters in Buffer Subzone |
|
|
Not
to cause the level of chlorophyll-a
in waters of the subzone to exceed 6 mg/m3, calculated as a
running arithmetic mean of 5 daily measurements for any single location and
depth. |
Marine Waters in Channel Subzone |
|
|
Toxic substances |
Should
not attain such a level as to produce significant toxic effects in humans,
fish or any other aquatic organisms. |
Whole zone |
Source: Statement of Water Quality Objectives (Tolo Harbour and
Channel Water Control Zone).
Note: The
delineation of Shing Mun River, Lam Tsuen River and Tai Po River Subzones are
defined in the following website: https://www.elegislation.gov.hk/hk/cap358F!en
Table 4.2 Water
Quality Objectives for Victoria Harbour (Phases One, Two and Three) WCZs
|
Parameters |
Objectives |
Sub-Zone |
|
Offensive odour, tints |
Not
to be present |
Whole
zone |
|
Visible foam, oil scum, litter |
Not
to be present |
Whole
zone |
|
Colour |
Should
not cause the colour of waters to exceed 50 Hazen units |
Inland Waters |
|
Dissolved oxygen (DO) within 2m of
the seabed |
Not
less than 2 mg/L for 90% of the sampling occasions during the whole year |
Marine
Waters |
|
Depth-averaged DO |
Not
less than 4 mg/L for 90% of the sampling occasions during the whole year |
Marine
Waters |
|
Not
less than 4 mg/L |
Inland
Waters |
|
|
pH |
To
be in the range of 6.5 - 8.5, human activity should not cause the natural pH
range to be extended by more than 0.2 |
Marine
Waters |
|
Not
exceed the normal pH range of 6.0 – 9.0 |
Inland
Waters |
|
|
Salinity |
Change
due to human activity not to exceed 10% of ambient salinity level |
Whole
zone |
|
Temperature |
Change
due to human activity not to exceed 2°C |
Whole
zone |
|
Chemical oxygen demand (COD) |
Not
exceed 30 mg/L |
Inland Waters |
|
5-day biochemical oxygen demand (BOD5) |
Not
exceed 5 mg/L |
Inland Waters |
|
Suspended solids (SS) |
Not
to raise the ambient level by more than 30% caused by human activity, nor
give rise to accumulation of suspended solids which may adversely affect
aquatic communities |
Marine
Waters |
|
Not
to cause the annual median level to exceed 25 mg/L. |
Inland
Waters |
|
|
Unionized ammonia (UIA) |
The
un-ionized ammoniacal nitrogen level should not be more than 0.021 mg/L
calculated as the annual average (arithmetic mean) |
Whole
zone |
|
Nutrients |
Shall
not cause excessive or nuisance growth of algae or other aquatic plants |
Marine
Waters |
|
Total inorganic nitrogen (TIN) |
Annual
mean depth-averaged inorganic nitrogen not to exceed 0.4 mg/L |
Marine
Waters |
|
E.
coli
Bacteria |
Not
exceed 1000 per 100mL, calculated as the geometric mean of the most recent 5
consecutive samples taken at intervals of between 7 and 21 days |
Inland Waters |
|
Toxic substances |
Should
not attain such levels as to produce significant toxic, carcinogenic, mutagenic
or teratogenic effects in humans, fish or any other aquatic organisms, with
due regard to biologically cumulative effects in food chains and to
interactions of toxic substances with each other |
Whole
zone |
|
Human
activity should not cause a risk to any beneficial use of the aquatic
environment |
Whole
zone |
Source: Statement of Water Quality Objectives
(Victoria Harbour (Phases One, Two and Three) WCZ)
Hong Kong Planning Standards and Guidelines
4.2.4 The Hong Kong Planning Standards and Guidelines (HKPSG), Chapter 9 (Environment), provides additional guidelines against water pollution for sensitive uses such as aquaculture and fisheries zones, bathing waters and other contact recreational waters.
Water Supplies Department Water Quality Criteria
4.2.5 The Water Supplies Department (WSD) has specified a set of target seawater quality objectives for their flushing water intakes. The list is shown in Table 4.3 below. These target objectives will be applied only at the points of seawater abstraction along the coastlines of inner Tolo Harbour and Victoria Harbour for flushing purpose.
Table 4.3 WSD’s Target Seawater Quality Objectives at
Flushing Water Intakes
|
Parameter (in mg/L unless otherwise
stated) |
WSD’s Target Water Quality Limit at
Flushing Water Intake |
|
Colour (Hazen Unit) |
<
20 |
|
Turbidity (NTU) |
<
10 |
|
Threshold Odour Number (odour unit) |
<
100 |
|
Ammonia Nitrogen (NH3-N) |
<
1 |
|
Suspended Solids (SS) |
<
10 |
|
Dissolved Oxygen (DO) |
>
2 |
|
5-Day Biochemical Oxygen Demand (BOD5) |
<
10 |
|
Synthetic Detergents |
<
5 |
|
E.
coli
(no./100mL) |
<
20,000 |
Remark:
The above objectives are only applicable to flushing water intakes from
seawater.
Cooling Water Intake Water Quality
Criteria
4.2.6
The water quality criteria for
cooling water intakes are different from that for the WSD’s intakes as their
beneficial uses are different (the former is used for cooling water system and
the latter for flushing purpose).
Victoria Harbour
4.2.7 There are a number of cooling water intakes identified in Victoria Harbour. Cooling water intakes in vicinity of the Project discharge point include the existing and planned cooling water intakes for Kai Tak District Cooling System (DCS), cooling water intakes for Yau Tong Bay Ice Plant, North Point Government Office and Taikoo Place. Based on the information available from the past relevant EIAs e.g. EIA for Kai Tak Development (approved in 2009) and EIA for Sha Tin Cavern Sewage Treatment Works (CSTW) (approved in 2016), no specific water quality requirement is available for these cooling water intakes. Regarding the two planned cooling water intakes of Kai Tak DCS at Kai Tak River and Kai Tak Approach Channel respectively (which are closest to the Project discharge point) as well as the existing cooling water intake of Kai Tak DCS at Kowloon Bay, their operator, i.e. Electrical and Mechanical Services Department (EMSD), has been confirmed under this EIA that no specific water quality criteria are available for these three DCS intakes. Correspondence from EMSD is provided in Appendix 4.1.
Tolo Harbour
4.2.8 There is one proposed cooling water intake point in Tolo Harbour for the proposed District Cooling System (DCS) at Hong Kong Science Park (HKSP). Based on the consultation with the project proponent, namely Hong Kong Science and Technology Park Corporation (HKSTPC), at the time of preparing this EIA, the proposed DCS is still under design stage and therefore, the DCS design is not yet confirmed. For the purpose of this EIA, the proposed DCS intake location is tentatively set at the closest point of the HKSP boundary to Tai Po Industrial Estate (TPIE) as shown in Figure 4.4. No specific water quality criteria are assumed for this proposed DCS intake following the existing Kai Tak DCS design.
Seawater Intake for Mariculture
4.2.9 One existing seawater intake in Tolo Harbour is operated by the Marine Science Laboratory of the Chinese University of HK (CUHK) for experimental maricultural purpose. A summary of the target seawater quality objectives at this intake point (provided by the intake operator) is given in Table 4.4 below. Supporting document from CUHK is attached in Appendix 4.1.
Table 4.4 Water Quality Objectives at Seawater Intake
of Marine Science Laboratory of CUHK
|
Parameter |
Target Water Quality Objectives |
|
Salinity |
No more than +/- 2
practical salinity unit (psu) from ambient level; < 2 psu change
over 1 hour |
|
Turbidity
|
<
5 NTU |
|
pH
|
7
to 9 |
|
Unionized
Ammonia (UIA) |
<
0.05 mg/L |
|
Suspended
Solids (SS) |
<
20 mg/L |
|
Dissolved
Oxygen (DO) |
>
5 mg/L |
|
Temperature |
No more than +/- 2oC
from ambient level; < 2oC change over 1 hour |
|
Faecal
coliforms |
<
10,000 colony forming unit (cfu) per 100 mL |
|
Ammonia
Nitrogen (NH3-N) |
<0.2
mg/L |
|
Nitrate
Nitrogen (NO3-N) |
<
0.5 mg/L |
|
Nitrite
Nitrogen (NO2-N) |
<
0.05 mg/L |
|
Hydrogen
Sulphide |
<0.001
mg/L |
Source:
Marine Science Laboratory of CHUK
Technical Memorandum on Effluent
Discharge Standard
4.2.10 Besides setting the WQOs, the WPCO controls effluent discharging into the WCZs through a licensing system. Guidance on the permissible effluent discharges based on the type of receiving waters (foul sewers, stormwater drains, inland and coastal waters) is provided in the Technical Memorandum on Standards for Effluents Discharged into Drainage and Sewerage Systems, Inland and Coastal Waters (TM-DSS). The limits given in the TM cover the physical, chemical and microbial quality of effluents. Any effluent discharge during the construction and operational stages should comply with the relevant standards as stipulated in the TM-DSS.
Professional Persons Environmental
Consultative Committee Practice Notes
4.2.11 The Professional Persons Environmental Consultative Committee Practice Note on Construction Site Drainage (ProPECC PN 1/94) provides good practice guidelines for dealing with various types of discharge from a construction site. Practices outlined in the ProPECC PN 1/94 should be followed as far as possible during construction to minimize the water quality impact due to construction site drainage. The Professional Persons Environmental Consultative Committee Practice Note on Drainage Plans subject to Comments by Environmental Protection Department (ProPECC PN 5/93) provides guidelines and practices for handling, treatment and disposal of various effluent discharges to stormwater drains and foul sewers. The design of site drainage and disposal of various site effluents generated within the development area should follow the relevant guidelines and practices as given in the ProPECC PN 5/93.
Sediment Deposition Criterion (Applicable to Ecological Subtidal
Habitats Only)
4.2.12 Potential impacts on benthic organisms, including corals, may arise through excessive sediment deposition. The magnitude of the potential impacts will be assessed based on the predicted sedimentation rate.
4.2.13 There is no existing legislative standard on sedimentation rate available. According to Pastorok and Bilyard [1] and Hawker and Connell[2], a sedimentation rate higher than 100 g/m2/day would introduce moderate to severe impact upon corals. This sedimentation rate of no more than 100 g/m2/day will be adopted as the assessment criterion for protecting the sediment sensitive ecological resources, following the approach used in the approved EIAs for “CSTW”, “Development of a Bathing Beach at Lung Mei, Tai Po”, “TPSTW Stage V”, “Wan Chai Development Phase II and Central-Wan Chai Bypass” and “Sha Tin to Central Link - Hung Hom to Admiralty Section” etc. This sedimentation rate criterion is considered to offer sufficient protection to marine ecological sensitive receivers and is anticipated to guard against unacceptable impacts. This protection has been confirmed by previous EM&A results which have indicated no adverse impacts to corals have occurred when this assessment criterion has been adopted.
4.2.14 This sedimentation criterion is used for protection of important subtidal habitats (e.g. corals) only and hence it is not applicable to other Water Sensitive Receivers (WSRs) such as bathing beach users and seawater intakes where the main concern would be on the surface / mid-depth water quality.
Water
Quality Criteria for Fish Culture Zones
4.2.15 Several Fish Culture Zones (FCZs) are identified in the Tolo Harbour as shown in Figure 4.4 below. The water quality criteria for FCZs will follow the Water Quality Objectives (WQOs) for Tolo Harbour and Channel WCZ stipulated under the Water Pollution Control Ordinance (WPCO). Table 4.5 summarizes the water quality criteria at FCZs with reference to the statutory WQOs.
Table 4.5 Water
Quality Criteria for Fish Culture Zones
|
Parameter (in
mg/L unless otherwise stated) |
Tolo Harbour and Channel WCZ |
||
|
Harbour Subzone |
Buffer Subzone |
Channel Subzone |
|
|
Yim Tin Tsai FCZ |
Yim Tin Tsai East FCZ |
Yung Shue Au and Lo Fu Wat FCZs |
|
|
DO Level within
2m from bottom |
≥ 2 |
≥ 3 |
≥ 4 |
|
DO Level in remainder
of water column |
≥ 4 |
≥ 4 |
≥ 4 |
|
Annual
Geometric Mean E. coli Level
(no./100mL) |
≤ 610 |
≤ 610 |
≤ 610 |
|
Running
Arithmetic Mean of 5 daily Measurements of Chlorophyll-a Level |
≤ 20 |
≤ 10 |
≤ 6 |
Remark: The above water quality criteria
are in accordance with the statutory WQOs for Tolo Harbour and Channel WCZ.
Full descriptions of the WQOs are provided in Table 4.1.
4.3
Water
Sensitive Receivers
Introduction
4.3.1 Beneficial uses of the water system(s) and Water Sensitive Receivers (WSRs) in the assessment areas have been identified with reference to the relevant topographic maps, aerial photos, Outline Zoning Plans as well as other published plans and relevant studies as presented below.
Victoria Harbour Water
Control Zone
4.3.2 The treated sewage effluent from daily operation of the TPSTW would be discharged into the marine water within the Victoria Harbour WCZ under the THEES. Major marine WSRs identified in Victoria Harbour are listed below and their indicative locations are given in Figure 4.3.
n
WSD Flushing Water Intakes;
n
Cooling Water Intakes;
n
Typhoon Shelters; and
n
Potential Water Sports Area at Kai Tak.
4.3.3 The feasibility of locating a potential water sports center within the Kai Tak Development (KTD) area is being investigated under the separate KTD project. The potential water sports area is included as a planned WSR. The existing intake of the first District Cooling System (DCS) plant at Kai Tak (currently in operation) is located at the ex-airport runway, which abstracts seawater from Kowloon Bay. A new Kai Tak DCS scheme with different intake locations is currently being planned under the separate KTD project. The proposed changes in the DCS intake locations have been considered in this EIA (see Sections 4.5.13 to 4.5.17). The planned Kai Tak DCS intake points are located in the lower reach of Kai Tak River and the mid-way of Kai Tak Approach Channel (KTAC).
4.3.4 Kai Tak River (KTR) is a man-made concrete nullah in highly developed urban land for drainage purpose. It is designed to receive treated sewage effluent from THEES, urban runoff from a large catchment area in Diamond Hill, Tsz Wan Shan, Wong Tai Sin, Kowloon City, San Po Kong and Kai Tak Development Area. The nullah has been continually modified and disturbed to suit the development needs in the vicinity. Based on the review of river water quality monitoring data collected by EPD in 2020, the E.coli levels at all the 6 monitoring stations in KTR significantly exceeded the WQO for inland waters. The BOD5 levels measured at 3 upstream stations in KTR also exceeded the WQO for inland waters in 2020. The Kai Tak River Improvement project including reconstruction of the nullah such as deepening the nullah bed to increase its drainage capacity was completed in 2018. Although this improvement project also covered works to revitalize the nullah, the proposed works did not aim to improve the nullah water quality. There is currently no plan to change the historic and existing uses of this nullah to receive treated sewage effluent and urban runoff and to alleviate flooding problem in urbanized area.
4.3.5 Therefore, it is suitable to consider KTR as an urban drainage and a non-sensitive receiver for the treated effluent discharge. The same approach has been adopted in the past relevant EIAs such as the approved EIAs for “CSTW”, “STSTW Stage III Extension” and “TPSTW Stage V”.
4.3.6 Following the existing disposal arrangement, only treated effluent that meets the effluent discharge standards will be diverted to Victoria Harbour WCZ via the THEES. Based on the findings of the approved EIAs for “STSTW Stage III Extension”, “TPSTW Stage V” and “CSTW”, the water quality effect of the THEES effluent would mainly be confined within the water bodies at or near the Kai Tak Development Area as shown in Figure 4.3. The open channel of Victoria Harbour outside the breakwaters of Kwun Tong Typhoon Shelter (KTTS) has strong tidal flushing capacity and its water quality would not be adversely affected by the existing THEES discharge. The coverage of the study area in Figure 4.3 is considered adequate for the purpose of this EIA.
Tolo Harbour and Channel Water Control Zone
4.3.7 Key marine WSRs in Tolo Harbour and Tolo Channel are listed below and their indicative locations are shown in Figure 4.4. The location of the existing emergency outfall of TPSTW in relation to the identified WSRs is also indicated in Figure 4.4.
n
WSD Flushing Water Intakes;
n
Cooling Water Intake for the proposed District Cooling System at Hong
Kong Science Park;
n
Seawater Intake of Marine Science Laboratory of CUHK;
n
Gazetted Beach at Lung Mei;
n
Shuen Wan Typhoon Shelter;
n
Various Corals / Mangroves along the Coastlines of Tolo Harbour and Tolo
Channel;
n
Fish Culture Zones (FCZs);
n
Hoi Ha Wan Marine Park /Site of Special Scientific Interest (SSSI);
n
Ting Kok SSSI;
n
Kei Ling Ha Mangal SSSI; and
n
Important Nursery Area for Commercial Fisheries Resources [3].
4.3.8 The marine water in Tolo Harbour and Channel WCZ are designated under the WPCO as secondary contact recreation subzone, which can be used for water sports and water recreational activities (e.g. sailing, rowing). The E. coli bacteria would be the principle parameter for assessing the acceptability of using waters for water sports or secondary contact recreation activities with a WQO of not exceeding 610 no./100mL (calculated as the geometric mean of all samples collected in one calendar year).
4.3.9
Locations of the ecological resources including the corals, mangroves and
SSSIs were identified from literature review and findings of marine ecological
survey carried out in the intertidal and coastal waters around Tai Po
Industrial Estate (TPIE) under this EIA. Descriptions of ecological and
fisheries resources are separately presented in the ecological impact
assessment and fisheries impact assessment of this EIA.
4.3.10
Inland waters within 500m from the site boundary of the Project includes
two modified watercourses to the north of TPIE as shown in Figure 4.5.
The lower reach of both
watercourses is connected to underground man-made culverts in TPIE, which would
eventually discharge to Tolo Harbour. As these inland watercourses are located
at the upstream of the proposed Project works, they would not be affected by
the Project and therefore are not considered as WSR of this Project.
4.4
Description
of the Environment
Introduction
4.4.1 The assessment areas for this water quality impact assessment cover the Tolo Harbour and Channel WCZ and Victoria Harbour WCZ designated under the WPCO.
4.4.2 The baseline conditions of the two WCZs were established from the marine water quality monitoring data collected by EPD. Descriptions of the baseline conditions provided in the subsequent sections are extracted from the EPD’s report “Marine Water Quality in Hong Kong in 2020”.
Victoria Harbour Water Control Zone
4.4.3 The water quality monitoring results at stations in vicinity of the Project discharge, namely VT4, VT11, VM1, VM2 and VM4 are shown in Table 4.6 below. The selected marine water quality monitoring stations are shown in Figure 4.3. Full compliances with the WQO for TIN, DO (depth average and bottom) and UIA were recorded at VT11, VM1, VM2, VM4 in 2020. The water quality recorded at VT4 in 2020 breached the WQO for TIN and DO (depth average) whilst achieved WQO compliance for DO (bottom layer) and UIA.
Table 4.6 Baseline Water Quality Condition for
Victoria Harbour WCZ in 2020
|
Parameter |
Victoria Harbour (East) |
Victoria Harbour (Central) |
Kwun Tong Typhoon Shelter |
To Kwa Wan Typhoon Shelter |
WPCO WQO (in marine waters) |
||
|
VM1 |
VM2 |
VM4 |
VT4 |
VT11 |
|||
|
Temperature
(°C) |
24.0 (19.4 – 28.9) |
24.3 (19.4 – 29.0) |
24.5 (19.6 – 28.9) |
24.7 (20.3 – 29.1) |
25.3 (19.6-29.1) |
Change due to human activity not to exceed 2°C |
|
|
Salinity (part
per thousand, ppt) |
32.3 (31.0 - 33.6) |
31.7 (28.9 - 33.2) |
31.4 (28.7 - 33.1) |
25.9 (20.0 - 29.8) |
31.3 (29.6 – 32.3) |
Change due to human activity not to exceed 10% of natural
ambient level |
|
|
Dissolved Oxygen (mg/L) |
Depth Average |
5.8 (4.2 – 7.6) |
5.7 (4.3 – 6.9) |
5.7 (4.4 - 6.9) |
4.5 (2.4 – 6.1) |
5.3 (4.6 - 6.4) |
Not less than 4
mg/L for 90% of the sampling occasions during the whole year |
|
Bottom |
5.8 (3.6 – 7.5) |
5.5 (3.8 – 7.2) |
5.6 (4.0 – 6.9) |
4.0 (2.2 – 5.2) |
4.8 (2.7 – 5.7) |
Not less than 2
mg/L for 90% of the. sampling occasions
during the whole year |
|
|
Dissolved Oxygen (% Saturation) |
Depth Average |
83 (61 - 100) |
81 (62 - 95) |
81 (64 - 92) |
62 (33 - 79) |
77 (69 – 84) |
Not available |
|
Bottom |
82 (51 - 104) |
77 (41 - 100) |
78 (40 - 96) |
56 (31 - 70) |
69 (40 – 84) |
Not available |
|
|
pH |
7.9 (7.7 - 8.2) |
7.9 (7.7 - 8.1) |
7.9 (7.5 - 8.1) |
7.5 (6.6 - 8.0) |
7.9 (7.6 - 8.2) |
6.5 - 8.5 (±
0.2 from natural range) |
|
|
Secchi Disc Depth (m) |
2.5 (1.8 – 3.0) |
2.4 (2.1 – 2.9) |
2.4 (2.0 – 3.1) |
2.0 (1.3 – 2.7) |
1.9 (1.2 – 2.6) |
Not available |
|
|
Turbidity (NTU) |
4.0 (1.5 – 5.8) |
3.5 (1.5 – 5.7) |
3.4 (1.2 – 6.4) |
3.6 (1.1 - 4.8) |
6.8 (2.7 – 15.5) |
Not available |
|
|
Suspended Solids (SS) (mg/L) |
7.1 (2.4 – 12.0) |
7.0 (2.6 – 13.7) |
7.1 (1.6 – 14.3) |
5.0 (1.2 – 10.5) |
11.8 (2.6 – 22.8) |
Not more than
30% increase |
|
|
5-day Biochemical Oxygen Demand (BOD5) (mg/L) |
0.9 (0.4 – 3.2) |
0.8 (0.3 – 1.9) |
0.8 (0.3 – 1.6) |
1.8 (1.3 – 2.4) |
0.7 (0.5 – 1.0) |
Not available |
|
|
Ammonia Nitrogen (NH3-N) (mg/L) |
0.072 (0.032 - 0.095) |
0.091 (0.027 - 0.153) |
0.112 (0.033 - 0.207) |
1.020 (0.417 – 1.340) |
0.167 (0.066 – 0.277) |
Not available |
|
|
Unionized Ammonia (UIA) (mg/L) |
0.003 (<0.001 - 0.006) |
0.003 (<0.001 - 0.006) |
0.004 (<0.001 - 0.007) |
0.017 (0.007 - 0.038) |
0.005 (0.003 – 0.007) |
Not more than
0.021 mg/L for annual mean |
|
|
Nitrite Nitrogen (NO2-N) (mg/L) |
0.022 (0.006 - 0.060) |
0.026 (0.007 - 0.072) |
0.028 (0.007 - 0.070) |
0.320 (0.150 - 0.430) |
0.026 (0.006 – 0.060) |
Not available |
|
|
Nitrate Nitrogen (NO3-N) (mg/L) |
0.096 (0.034 - 0.217) |
0.133 (0.036 - 0.277) |
0.149 (0.051 - 0.287) |
0.995 (0.363 – 1.340) |
0.106 (0.023 – 0.163) |
Not available |
|
|
Total Inorganic Nitrogen (TIN) (mg/L) |
0.19 (0.12 - 0.34) |
0.25 (0.12 - 0.43) |
0.29 (0.15 - 0.45) |
2.33 (0.93 –3.06) |
0.30 (0.09 – 0.46) |
Not more than
0.4 mg/L for annual mean |
|
|
Total Kjeldahl Nitrogen (TKN) (mg/L) |
0.56 (0. 20 – 1.23) |
0.61 (0.36 – 1.20) |
0.62 (0.35 - 1.07) |
1.57 (0.85– 1.93) |
0.63 (0.45 – 0.77) |
Not available |
|
|
Total Nitrogen (TN) (mg/L) |
0.68 (0.41 – 1.32) |
0.76 (0.47 – 1.30) |
0.80 (0.55 – 1.19) |
2.88 (1.37 – 3.67) |
0.76 (0.48 – 0.92) |
Not available |
|
|
Orthophosphate Phosphorus (PO4) (mg/L) |
0.014 (0.005 - 0.022) |
0.017 (0.005 - 0.035) |
0.019 (0.011 - 0.032) |
0.339 (0.090 - 0.503) |
0.019 (0.010 – 0.034) |
Not available |
|
|
Total Phosphorus (TP) (mg/L) |
0.05 (0.03 - 0.07) |
0.05 (0.03 - 0.08) |
0.06 (0.03 - 0.08) |
0.42 (0.14 - 0.60) |
0.07 (0.05 – 0.09) |
Not available |
|
|
Silica (as SiO2) (mg/L) |
0.83 (0.35 - 1.37) |
0.90 (0.32 - 1.73) |
1.01 (0.33 - 1.77) |
3.65 (1.61– 6.83) |
0.86 (0.55 – 1.30) |
Not available |
|
|
Chlorophyll-a (μg/L) |
2.3 (0.2 – 9.7) |
3.2 (<0.2 - 14.0) |
3.1 (0.4 - 12.1) |
5.4 (1.3 - 12.4) |
1.2 (0.2 -2.6) |
Not available |
|
|
E. coli (no./100mL) |
150 (51 - 1600) |
240 (59 - 1600) |
290 (27 - 1200) |
15000 (600 - 73000) |
800 (140 - 11000) |
Not available |
|
|
Faecal Coliforms (no./100mL) |
300 (83 - 4100) |
550 (86 - 3300) |
740 (89 - 4100) |
32000 (1100 - 280000) |
1500 (200 – 19000) |
Not available |
|
Notes:
1.
Data
source: EPD Marine Water Quality in Hong Kong in 2020.
2.
Unless
otherwise specified, data presented are depth-averaged (A) values calculated by
taking the means of three depths: Surface (S), Mid-depth (M), Bottom (B).
3.
Data
presented are annual arithmetic means of depth-averaged results except for E.
coli and faecal coliforms that are annual geometric means.
4.
Data in
brackets indicate the ranges.
Trend of Water Quality in Victoria Harbour
4.4.4 The Victoria Harbour WCZ achieved an overall WQO compliance rate of 90% in 2020, with full compliance with the DO and UIA WQOs. Under the influence of regional background level in the Pearl River Estuary as well as local pollution sources, only 70% of the monitoring stations in the WCZ met the TIN WQO.
4.4.5 The E. coli level in the eastern side of Victoria Harbour has decreased markedly since the implementation of Harbour Area Treatment Scheme (HATS) Stage 1 in 2001. The annual Cross Harbour Swim, suspended since 1979 because of poor water quality, was resumed on the eastern side of the harbour in 2011 after implementation of the HATS Advance Disinfection Facilities (ADF). With full commissioning of the HATS Stage 2A, the E.coli level of the central harbour area has been further reduced. Since 2017, the race route of the event has returned to the traditional route in the central harbour area.
Tolo Harbour and Channel WCZ
4.4.6 The water quality monitoring results at stations closest to the existing emergency outfalls of sewage effluent discharges in Tolo Harbour, namely TM2, TM3 and TM4 in Harbour Subzone are shown in Table 4.7 below. The selected marine water quality monitoring stations are shown in Figure 4.4. Full compliances with the WQO was recorded at all the three selected stations for DO, chlorophyll-a and E. coli in 2020.
Table 4.7 Baseline Water Quality Condition for Tolo
Harbour and Channel WCZ in 2020
|
Parameter |
Harbour Subzone |
WPCO WQO (in marine waters) |
|||
|
TM2 |
TM3 |
TM4 |
|||
|
Temperature (°C) |
26.3 (20.6 - 29.8) |
25.1 (20.2– 29.5) |
25.6 (20.0 – 29.6) |
n
Change due to
waste discharge not to exceed 1°C n The rate of temperature change not to
exceed 0.5 °C per hour, unless due to natural phenomena |
|
|
Salinity (part per thousand, ppt) |
29.9 (24.8- 32.8) |
31.0 (24.9- 33.7) |
30.8 (27.1- 33.1) |
Change due to
waste discharge not to be greater than ±3ppt |
|
|
Dissolved Oxygen (mg/L) |
Depth Average |
6.1 (5.1 – 7.9) |
6.4 (5.3– 7.2) |
6.1 (5.1 – 6.5) |
Not less than 4
mg/L in the water column (except for the bottom water later within 2 m from
the seabed) |
|
Bottom |
6.2 (4.5 – 8.3) |
5.9 (3.8 – 7.2) |
5.4 (2.9 – 6.5) |
Not less than 2 mg/L within 2 m from the seabed |
|
|
Dissolved Oxygen (% Saturation) |
Depth Average |
89 (73 - 112) |
92 (79 - 104) |
88 (75 - 97) |
Not available |
|
Bottom |
90 (70 - 120) |
86 (58 - 110) |
78 (38 - 99) |
Not available |
|
|
pH |
8.0 (7.7 - 8.3) |
8.0 (7.6 - 8.3) |
8.0 (7.8 - 8.2) |
Change due to
waste discharge not to be greater than ± 0.5 from natural range |
|
|
Secchi Disc Depth (m) |
2.4 (1.6 - 3.4) |
2.3 (1.5 - 3.2) |
2.7 (1.8 – 3.5) |
Not available |
|
|
Turbidity (NTU) |
3.1 (1.5 – 5.5) |
2.3 (0.7 – 4.9) |
2.5 (1.2 - 4.1) |
Not available |
|
|
Suspended Solids (SS) (mg/L) |
8.1 (1.4 – 17.0) |
8.2 (1.4- 19.3) |
8.5 (1.0 – 18.7) |
Not available |
|
|
5-day Biochemical Oxygen Demand (BOD5) (mg/L) |
1.7 (0.8 – 2.6) |
1.8 (1.2 – 2.9) |
1.4 (0.7 – 2.5) |
Not available |
|
|
Ammonia Nitrogen (NH3-N) (mg/L) |
0.045 (0.022 - 0.076) |
0.046 (0.011 - 0.127) |
0.036 (0.019 - 0.076) |
Not available |
|
|
Unionized Ammonia (UIA) (mg/L) |
0.003 (<0.001 - 0.005) |
0.002 (<0.001 - 0.006) |
0.002 (<0.001 - 0.004) |
Not available |
|
|
Nitrite Nitrogen (NO2-N) (mg/L) |
0.004 (<0.002 - 0.010) |
0.003 (<0.002 - 0.006) |
0.003 (<0.002 - 0.006) |
Not available |
|
|
Nitrate Nitrogen (NO3-N) (mg/L) |
0.039 (<0.002 - 0.215) |
0.013 (0.002 - 0.049) |
0.009 (<0.002 - 0.027) |
Not available |
|
|
Total Inorganic Nitrogen (TIN) (mg/L) |
0.09 (0.03 - 0.27) |
0.06 (0.02 - 0.16) |
0.05 (0.02 - 0.11) |
Not available |
|
|
Total Kjeldahl Nitrogen (TKN) (mg/L) |
0.50 (0.22 - 0.81) |
0.56 (0.25 - 0.86) |
0.56 (0.30 - 0.85) |
Not available |
|
|
Total Nitrogen (TN) (mg/L) |
0.54 (0.29 - 0.82) |
0.57 (0.30 - 0.86) |
0.57 (0.31- 0.85) |
Not available |
|
|
Orthophosphate Phosphorus (PO4) (mg/L) |
0.008 (0.002 - 0.026) |
0.006 (0.003 - 0.014) |
0.005 (<0.002 - 0.007) |
Not available |
|
|
Total Phosphorus (TP) (mg/L) |
0.04 (<0.02 - 0.06) |
0.04 (<0.02 - 0.06) |
0.03 (<0.02 - 0.05) |
Not available |
|
|
Silica (as SiO2) (mg/L) |
1.48 (0.50 – 4.15) |
0.84 (0.15 - 2.13) |
0.82 (0.29 - 1.80) |
Not available |
|
|
Chlorophyll-a
(μg/L) |
5.8 (1.4 – 9.2) |
5.8 (2.1 - 15.7) |
5.2 (1.5 – 14.3) |
Not to exceed
20 μg/L for a running arithmetic mean of 5 daily measurements |
|
|
E. coli (no./100mL) |
13 (<1 - 4500) |
18 (<1 - 2700) |
5 (<1 - 490) |
Not to exceed
610 no./100mL for geometric mean |
|
|
Faecal Coliforms (no./100mL) |
76 (6 - 32000) |
76 (1 - 13000) |
23 (1 - 3100) |
Not available |
|
Notes:
1.
Data
source: EPD Marine Water Quality in Hong Kong in 2020.
2.
Unless
otherwise specified, data presented are depth-averaged (A) values calculated by
taking the means of three depths: Surface (S), Mid-depth (M), Bottom (B).
3.
Data
presented are annual arithmetic means of depth-averaged results except for E.
coli and faecal coliforms that are annual geometric means.
4.
Data in
brackets indicate the ranges.
Trend of Water Quality in Tolo Harbour and Channel
4.4.7 The overall marine WQO compliance rate for the Tolo Harbour and Channel WCZ in 2020 was 93% as compared to 79% in 2019. The compliance rate for the DO WQO maintained at 57%, same as 2018 and 2017. Furthermore, the Tolo Harbour and Channel WCZ consistently complied with the bacteriological WQO for the secondary contact recreation uses applicable to the entire marine water of the WCZ.
4.4.8 Tolo Harbour, however, was subject to a natural hydrological phenomenon of water stratification and associated lower bottom DO level due to restricted water exchange with open waters.
4.4.9 Upon the implementation of the Tolo Harbour Action Plan since the mid-1980s, there has been a marked improvement in the water quality in Tolo Harbour in the past three decades.
4.5
Consideration
of Concurrent Projects
Project Programme
4.5.1 The construction works of this Project are tentatively scheduled to commence in 2025 for completion in 2036.
Proposed Sha Tin Cavern Sewage Treatment Works
4.5.2 The key components of the THEES and the existing TPSTW effluent disposal arrangement are described in Section 4.1.2. Currently, the treated effluent from TPSTW would occasionally exceed the capacity of the TPEPS due to the effect of storm and hence part of the treated effluent from TPSTW would be discharged to the Tolo Harbour via the existing emergency bypass outfall at TPSTW. Similarly, the combined flow from TPSTW and STSTW would also occasionally exceed the capacity of STEPS due to the storm effect and overflow of the combined effluent would be discharged into the Tolo Harbour via the existing emergency submarine outfall of STSTW.
4.5.3 Under the proposed concurrent project “Sha Tin Cavern Sewage Treatment Works (CSTW)”, a separate gravity sewer bypassing the STEPS is proposed for connection of the treated effluent from the new CSTW directly to the Effluent Export Tunnel of the THEES. Overflow of treated effluent flow from the new CSTW into the Tolo Harbour would not arise during normal plant operation [4]. The CSTW project is currently under construction phase and is anticipated to commission before 2030. The land-based construction works of the proposed CSTW would be outside the assessment area of this Project.
Proposed THEES Upgrading
4.5.4 The effluent conveyance capacity of the existing TPEPS and submarine pipeline of THEES is 4,752 m3 per hour. It is proposed under the “Agreement No. CE 13/2015 (DS) Review of Sewerage Infrastructure of THEES – Feasibility Study” to upgrade the capacity of TPEPS and submarine pipeline to 18,396 m3 per hour, of which about 12,996 m3 per hour will cater for the effluent from TPSTW. The remaining capacity of about 5,400 m3 per hour is allowed for the potential treated effluent from other district(s). The design, arrangement and implementation programme of the potential treated effluent from the other district(s) are not available and will not be considered in this EIA. The effluent pumping system of TPSTW will also be modified to convey the TPSTW effluent directly to the inlet chamber of THEES tunnel portal. Intermediate pumping station at Sha Tin may not be necessary and the existing STEPS will be decommissioned.
4.5.5 The rate of TPSTW effluent discharge to the THEES tunnel would be limited by the pumping capacity of TPEPS. Any peak or surplus TPSTW flow exceeding the pumping capacity of TPEPS (e.g. due to storm events) would be overflowed to Tolo Harbour at the emergency outfall of TPSTW at Tai Po. The maximum capacity of the existing THEES tunnel is 946,080 m3/day. It was assessed under the Agreement No. CE 13/2015 (DS) that the THEES tunnel and its downstream facilities are adequate to handle the effluent flow conveyed by the upgraded TPEPS of 18,396 m3 per hour with consideration of the future CSTW discharge. The upgraded TPEPS capacity is also smaller than the existing capacity of STEPS of 21,600 m3 per hour. Therefore, in any case, no overflow of TPSTW effluent would occur at Sha Tin with or without the proposed THEES upgrading works.
4.5.6 The proposed THEES upgrading works involve construction of a new TPEPS, a new submarine pipeline and a new effluent rising mains. The THEES upgrading works are tentatively scheduled to commence in 2025 for completion in 2031, subject to the construction programme of this Project (upgrading of TPSTW) and the CSTW project.
4.5.7 The new submarine pipeline will be installed by the Horizontal Directional Drilling (HDD) method, which is a trenchless method with no disturbance to the seabed and marine habitat. The proposed driving pit and reception pit of the HDD works would be land-based and located at the helipad in TPIE (within the assessment area) and Pak Shek Kok (outside the assessment area) respectively. The new rising mains will be laid in the southern TPIE (within the assessment area) connecting between the new TPEPS and the new submarine pipeline.
4.5.8 At the time of preparing this EIA, “Agreement No. CE 13/2015 (DS) Review of Sewerage Infrastructure of THEES – Feasibility Study” is still on-going and therefore the design of the proposed THEES upgrading project is subject to further update. The design assumptions presented in this EIA represent the best available information for use in this water quality impact assessment.
Proposed Shuen Wan Golf Course
4.5.9 The proposed Shuen Wan Golf Course (SWGC) is located to the east of the Project site. It mainly involves the development of a new golf course within the existing Shuen Wan Restored Landfill (SWRL) site. According to the EIA Report for SWGC, the construction of the proposed SWGC would be completed by end 2023 prior to the construction of this Project.
Proposed Organic Waste
Pre-treatment Centre
4.5.10 Development of Organic Waste Pre-treatment Centre (New Territories East) is proposed under “Agreement No. CE 5/2021 (EP)”. The proposed Organic Waste Pre-treatment Centre (OWPC) involves the re-development of the existing Shuen Wan Landfill Leachate Pre-treatment Works and the existing pilot-scale Food Waste Pre-treatment Facilities into a full-scale organic waste (mostly food waste) pre-treatment plant to receive and pre-treat the source-separated food waste for transferring to the TPSTW and / or off-site anaerobic digesters in other Sewage Treatment Works (STWs) for co-digestion with sewage sludge. The proposed OWPC site is located to the north of the existing TPSTW site within the assessment area of this Project. It is tentatively scheduled to commence construction in 2025 for completion by 2029.
Proposed District Cooling
System at Hong Kong Science Park
4.5.11 A new District Cooling System (DCS) is being proposed at the Hong Kong Science Park (HKSP). The intake of this proposed DCS is considered as a WSR of this Project (refers to Section 4.2.8). The HKSP including the proposed DCS is over 3.3 km away from the Project site. Cumulative water quality impact due to the construction of the DCS is not expected.
4.5.12 The key water quality concerns of the proposed DCS operation would be associated with the spent cooling water discharges including the spreading of thermal plume and release of anti-fouling agent or biocide (e.g. residual chlorine, C-Treat-6) into the marine environment. As this Project would not induce any thermal impact nor discharge of fouling agent/ biocide, there will not be any cumulative water quality impact due to the DCS operation.
Kai Tak Development – Interception and Pumping Scheme
4.5.13 Currently, the existing DCS South Plant is operated at Kai Tak, which extracts seawater from Kowloon Bay for cooling purpose and the spent cooling water is discharged back into Kowloon Bay. Both the intake and outfall of the existing DCS South Plant are located at a similar location along the ex-airport runway in the open water of Kowloon Bay.
4.5.14 Based on the latest information from Agreement No. CE 30/2008 (CE) [5] obtained from Civil Engineering and Development Department (CEDD), a new Interception and Pumping (IP) Scheme will be implemented under the Kai Tak Development (KTD). The proposed IP Scheme would involve one cooling water intake point at the lower reach of KTR and another intake point at the mid-way of KTAC. The water pumped from KTR and KTAC will be diverted to three Kai Tak DCS Plants (namely existing DCS South Plant, proposed Additional DCS North Plant and proposed 3rd DCS Plant) and all the spent water would be discharged into the Kowloon Bay as shown in Figure 4.6.
4.5.15 The proposed IP scheme would divert the water in the embayed areas at KTR and KTAC to the more open water in Kowloon Bay and would therefore improve the water circulation and water quality in KTAC.
4.5.16 The rates of water interception and pumping from KTR and KTAC would be the same as the design flow rates of the DCS plants. The relevant DCS design flow rates available from Agreement No. CE 30/2008 (CE) [6] are adopted in this EIA as the ultimate design flows of the IP scheme. The monthly varying average daily flows of the three DCS plants are adopted in this water quality modelling exercise.
4.5.17 As advised by CEDD, the design of the IP scheme is still on-going and the timing for finalization of the IP scheme design is not known. The descriptions of the proposed IP scheme as presented in this EIA represent the best available information. The 600m wide opening at the ex-airport runway proposed under the previous EIA for KTD had been superseded by the IP scheme. No opening at the ex-airport runway is assumed in this EIA.
4.6
Identification of Potential Impacts
Construction Phase
4.6.1 The existing TPSTW comprises two independent plants, namely West Plant and East Plant. The existing design capacity of the West Plant is 44,000 m3/day. The existing design capacity of the East Plant is 76,000 m3/day. The overall design capacity of the existing TPSTW is therefore 120,000 m3/day. Owing to the space limitation within the existing TPSTW and in order to maintain the sewage treatment services of the existing TPSTW, a piece of government land to the south of the existing TPSTW (about 1.6 hectares) is identified as the proposed expansion site for the Project. Upgrading of TPSTW is designed to maintain normal operation of the existing TPSTW. A New West Plant will be built in the proposed expansion site that will provide adequate sewage treatment capacity to meet the projected sewage flow buildup prior to the decommissioning and demolition of the existing treatment works to the north of the proposed expansion site to make room for the remaining upgrading works. Commissioning of the New West Plant is tentatively scheduled in 2029. Under this construction approach, no temporary discharge of untreated or partially treated sewage effluent into the marine water will be allowed during the construction phase. The treated effluent from the New West Plant will be discharged via the THEES following the existing effluent disposal arrangement.
4.6.2 With reference to Sections 4.1.2 and 4.5.2, during normal operation, any effluent bypass from TPSTW to the Tolo Harbour will be discharged through the existing emergency outfall at the seawall (to the south of TPIE) as shown in Figure 4.2. This existing emergency outfall is in the form of underground sewage pipeline for diverting the effluent from TPEPS to the seawall. The existing sewage pipeline has been reviewed to have sufficient capacity to handle the maximum design flow of this Project. No outfall construction / modification will be required for this Project. This Project will not disturb the seawall and marine sediments and will not affect the sediment quality.
4.6.3 Only land-based construction will be carried out under the Project. The construction works will be undertaken at TPIE within Tolo Harbour and Channel WCZ only. No construction works will be undertaken in the Victoria Harbour WCZ. The proposed construction works will not alter any inland waters such as natural streams, watercourses and ponds as identified in Section 4.3.10. Decommissioning and demolition of existing facilities in the proposed expansion site is outside the scope of this Project and not considered in this assessment.
4.6.4 Potential sources of water quality impact associated with the Project during the construction phase are identified as follows:
n
General land-based construction activities;
n
Construction site run-off;
n
Accidental chemical spillage;
n
Sewage effluent from construction workforce;
n Contaminated site runoff; and
n Demolition works.
Operational
Phase – Project Effluent Discharge
Design
Flow and Effluent Standards
4.6.5 The 2019-based Territorial Population and Employment Data Matrix (TPEDM) provided by the Planning Department (PlanD) have been considered in the development of the design flow of this Project. The 2019-TPEDM covers all known development and redevelopment proposals within the territory.
4.6.6 With reference to the latest population and employment forecast available from the 2019-based TPEDM, the proposed design capacity of this Project of 160,000 m3/day has been reviewed to be sufficient to cater for the sewage flow generated from the future developments within the catchment of TPSTW in Year 2041. The existing treatment process of TPSTW is secondary treatment works plus disinfection. The current treatment levels and the associated effluent standards of the existing TPSTW will be maintained for this Project as summarized in Table 4.8.
Table 4.8 Effluent Standards of Existing TPSTW and
Proposed Project
|
Parameter |
Unit |
95th percentile |
Maximum |
Annual
Average |
Monthly
Geometric Mean |
|
5-day Biochemical Oxygen
Demand (BOD5) |
mg/L |
20 |
40 |
- |
- |
|
Total Suspended Solids
(TSS) |
mg/L |
30 |
60 |
- |
- |
|
Total Nitrogen (TN) |
mg/L |
- |
35 |
20 |
- |
|
Ammonia Nitrogen (NH3-N)
|
mg/L |
- |
10 |
5 |
- |
|
E. coli |
counts/100mL |
15,000 |
- |
- |
1,000 |
Treated Sewage Effluent
Reuse for Non-potable Use
4.6.7 Advance treatment facilities would be provided for further processing some of the Treated Sewage Effluent (TSE) from the upgraded TPSTW to produce reclaimed water that meets the required water quality standards for non-potable use (e.g. toilet flushing, landscape irrigation).
4.6.8
The spent reclaimed water would
be eventually discharged back to the treatment works for treatment again and
would not contribute to additional pollution load to the water environment.
Thus, no additional impact on the water environment will be induced by the TSE
reuse. The reclaimed water
standards provided by Water Supplies Department (WSD) are shown in Table 4.9. Tertiary treatment will be provided in the reuse facility to treat
the TSE. The treated TSE from the reuse facility will meet the WSD’s standards.
Table 4.9 Reclaimed
Water Requirements – WSD Water Quality Objectives
|
Parameter |
Unit |
Reclaimed Water Quality |
|
E. coli |
cfu/100mL |
Non detectable |
|
Total Residual Chlorine |
mg/L |
≥1 (existing treatment system) |
|
Dissolved Oxygen (DO) |
mg/L |
≥2 |
|
TSS |
mg/L |
≤5 |
|
Colour |
Hazen Unit (HU) |
≤20 |
|
Turbidity |
NTU |
≤5 |
|
pH |
- |
6 to 9 |
|
Odour |
Threshold odour no. |
≤100 |
|
BOD5 |
mg/L |
≤10 |
|
NH3-N |
mg/L as N |
≤1 |
|
Synthetic Detergents |
mg/L |
≤5 |
Note: Information provided and
confirmed by Water Supplies Department
4.6.9
Some of the treated effluent from
the Project will be directly reused in the sewage treatment process (e.g. for
polymer preparation) within the Project site. Partially treated sewage,
including but not limited to surplus activated sludge (SAS), supernatant from
thickened SAS, primary effluent from the Project, may also be explored for
directly reuse in the treatment process (e.g. for imported sludge dilution)
within the Project site.
4.6.10
Some treated effluent of the
Project will be transferred to the proposed OWPC directly for use in the food
waste pre-treatment process or dilution of food waste.
4.6.11
All the treated effluent and/or
partially treated sewage to be used in the treatment process of this Project
and the proposed OWPC will be conveyed and handled within an automatic
close-loop system without direct human contact. All treated effluent and/or
partially treated sewage will be conveyed through enclosed pipelines. Water quality impact associated with the possible spillage during
transportation of the treated/partially treated sewage effluent is not
expected.
4.6.12
Any spent treated effluent and/or partially treated effluent will be transferred back to sewerage system or the treatment units of this Project by
fully enclosed pipelines for further treatment. No adverse water quality impact
and human health concern will arise.
Treated Effluent
Overflow to Tolo Harbour under Normal Plant Operation
Baseline “Do-nothing” Scenario
4.6.13 Under the baseline scenario, no upgrading of TPSTW and TPEPS would be carried out. The design capacity of TPSTW and TPEPS would remain to be 120,000 m3/day and 4,752 m3 per hour respectively. The CSTW project is currently under construction and will be included in the baseline scenario.
4.6.14 The treated effluent from TPSTW would occasionally exceed the existing capacity of the TPEPS due to the effect of storm and part of the secondarily treated and disinfected effluent from TPSTW would be discharged to Tolo Harbour via the emergency outfall of TPSTW. With the CSTW project, no overflow would occur at Sha Tin (see Section 4.5.3 to 4.5.5).
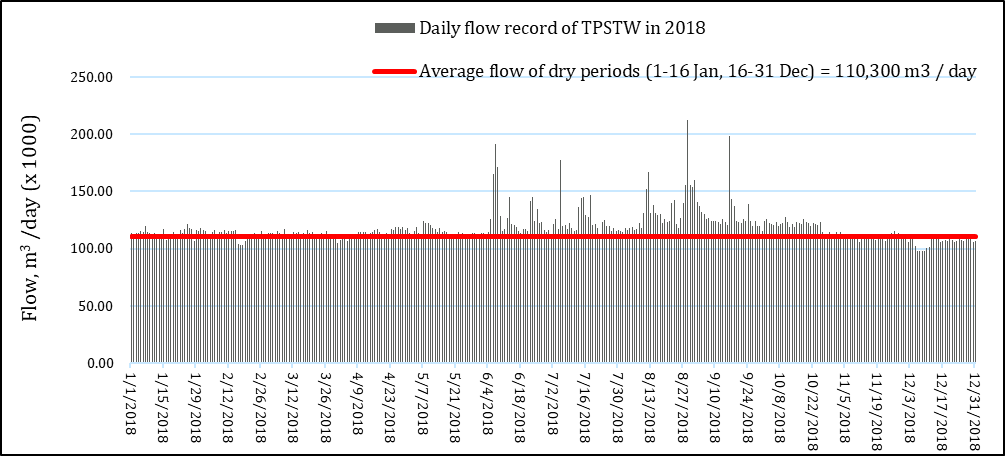
4.6.15 The quantities of overflow bypass would be subject to the effect of storm. Based on the review of past overflow records of TPSTW (from 2013 to 2018) conducted under Agreement No. CE 13/2015 (DS) [7], the low flow periods where storm events are rare occur in 1-16 January and 16-31 December.
4.6.16 The peaking factor analysis covering the period from 2013 to 2018 carried out under Agreement No. CE 13/2015 (DS) concluded that TPSTW has the highest peaking factor in 2018. The discharge record for 2018 as shown in Exhibit 4.1 below are therefore used to estimate the overflow quantities of TPSTW. The recorded average dry weather flow (ADWF) of TPSTW in 2018 was about 110,300m3/day. This value is used as benchmark and any days with surplus flow above this ADWF value is assumed to be wet days with storm events.
Exhibit 4.1 Daily Flow
Record of TPSTW in 2018
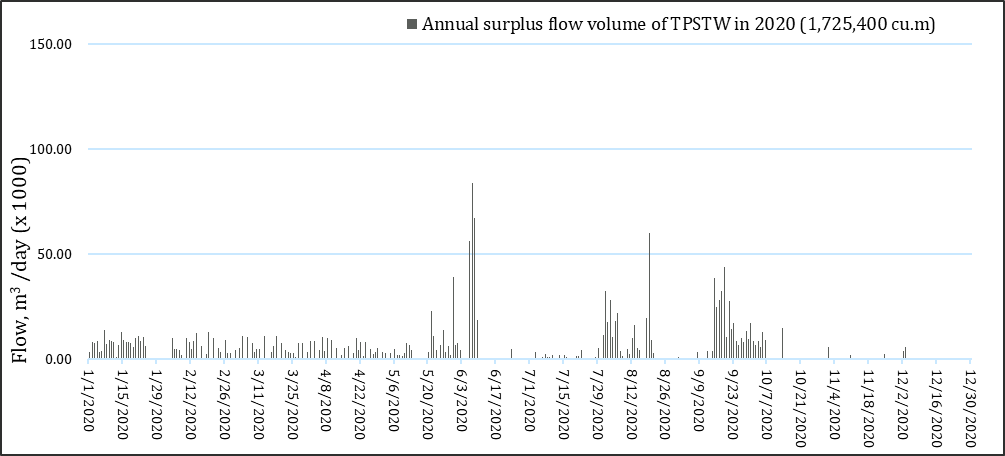
4.6.17 4.2 below shows the surplus flow recorded in 2018. Similar analysis has been conducted under this EIA using the latest daily flow record of TPSTW in 2019 and 2020. The resulted surplus flow of TPSTW in 2019 and 2020 is shown in Exhibit 4.3 and Exhibit 4.4. Both the peak surplus flow value and the annual surplus flow volume in 2019 and 2020 are smaller than those recorded in 2018. Therefore, using the surplus flow of 2018 in estimation of the overflow quantities is conservative and appropriate. The average and maximum daily discharge of TPSTW from 2018 to 2020 are summarized in Table 4.10.
Table 4.10 TPSTW Discharge
(2018 – 2020)
|
Year |
Average
Daily Effluent Flow (m3) |
Maximum
Daily Effluent Flow (m3) |
|
2018 |
118,263 |
212,539 |
|
2019 |
118,833 |
199,888 |
|
2020 |
111,607 |
192,466 |
Exhibit 4.2 Surplus Flow
of TPSTW in 2018
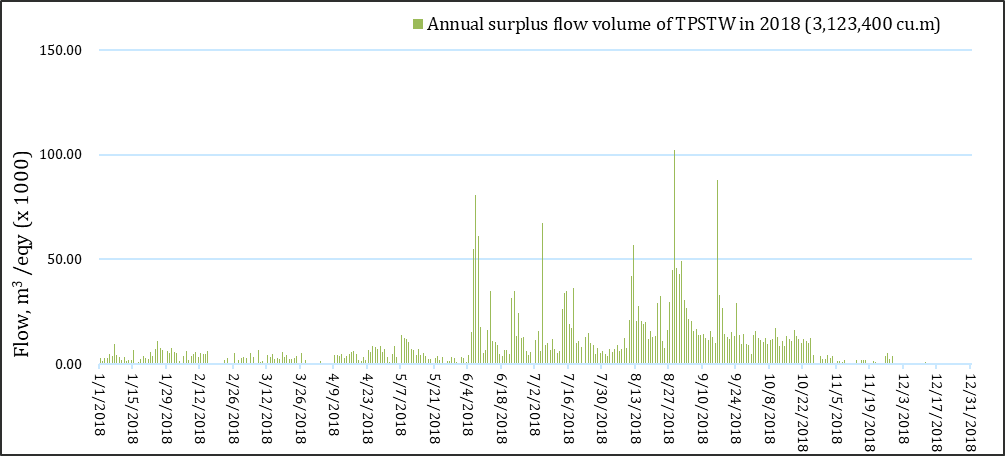
Exhibit 4.3 Surplus
Flow of TPSTW in 2019
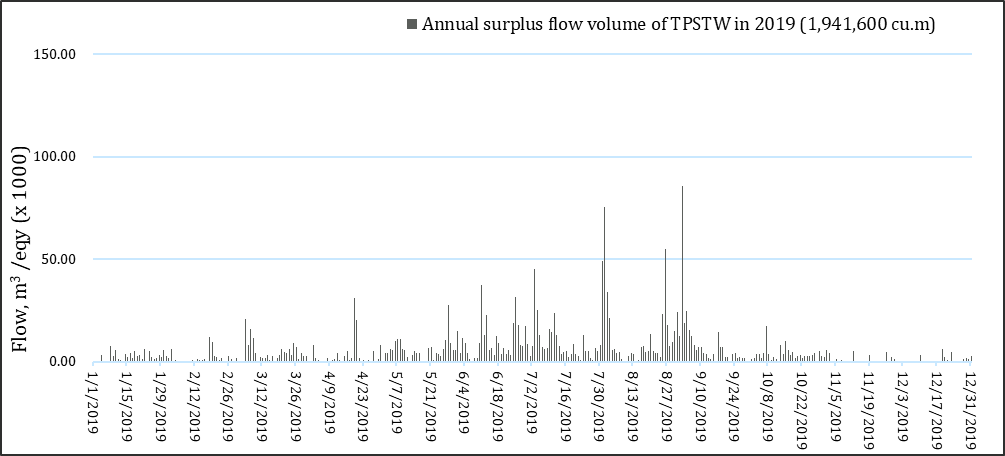
Exhibit 4.4 Surplus Flow of TPSTW in 2020
4.6.18
The surplus for each wet day is
allocated to the existing design ADWF of TPSTW (i.e. 120,000 m3/day)
on the same day to take into account of the effect of storm events. The plot of
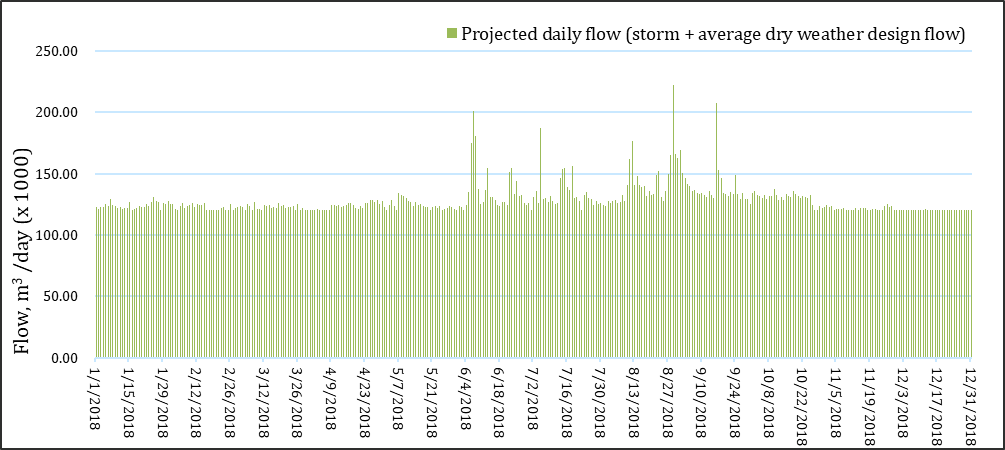
the projected daily discharge rate of TPSTW under the baseline “without
Project” scenario assuming a design daily flow of 120,000 m3/day is shown in Exhibit 4.5.
Exhibit 4.5 Projected
Daily Discharge Rate of TPSTW – Baseline “Do-nothing” Scenario
4.6.19 The typical dry weather diurnal flow pattern of TPSTW in 2018 is shown in Table 4.11. The percentages in the tables are applied to the existing design ADWF of TPSTW (i.e. 120,000 m3/day) to derive the hourly dry weather diurnal flow of TPSTW. Latest dry weather diurnal flow record after 2018 is not available from DSD.
Table 4.11 Typical Dry Weather Diurnal Flow Pattern of
TPSTW in 2018
|
Hour |
% of Daily Flow |
Hour |
% of Daily Flow |
Hour |
% of Daily Flow |
Hour |
% of Daily Flow |
|
0:00 |
4.72% |
6:00 |
3.08% |
12:00 |
4.34% |
18:00 |
4.16% |
|
1:00 |
4.13% |
7:00 |
3.68% |
13:00 |
4.47% |
19:00 |
4.24% |
|
2:00 |
3.58% |
8:00 |
4.06% |
14:00 |
4.83% |
20:00 |
4.39% |
|
3:00 |
3.44% |
9:00 |
4.66% |
15:00 |
4.57% |
21:00 |
4.66% |
|
4:00 |
3.32% |
10:00 |
4.24% |
16:00 |
4.16% |
22:00 |
4.97% |
|
5:00 |
3.13% |
11:00 |
4.20% |
17:00 |
4.01% |
23:00 |
4.95% |
Source: Agreement No.
CE 13/2015 (DS)
4.6.20 The storm flow generated from each wet day is assumed to be contributed from a 4-hour storm event. The surplus flow for each wet day in Exhibit 4.2 is allocated to the dry weather diurnal flow on the same day between 20:00 and 23:00. As the highest diurnal flow rates are observed between 20:00 and 23:00 in Table 4.11, allocating the surplus flow for each wet day to this period would represent a reasonable worst case. When the combined volume of surplus flow (if any) and dry weather diurnal flow of the TPSTW exceeds the existing capacity of TPEPS of 4752 m3/hour, the effluent would overflow into Tolo Harbour. The hourly overflow rates at the ultimate design stage are estimated for a complete calendar year as shown in Exhibit 4.6 below. Due to the capacity constraint of the existing TPEPS, overflow from TPSTW would occur in both dry and wet seasons. The annual overflow volume under the “do-nothing” scenario is estimated to be about 6,842,000 m3. The annual overflow volume estimated under the approved EIA for “TPSTW Stage V” is larger because a larger design flow of 130,000 m3/day was assumed in that EIA.
“With Project” Scenario
4.6.21 The “with Project” scenario assumes that the capacities of TPSTW and TPEPS will be upgraded.
4.6.22 The typical dry weather diurnal flow pattern of TPSTW in Table 4.11 above is applied to the design flow of the Project (i.e. 160,000 m3/day) to derive the hourly dry weather diurnal discharge. The surplus flow for each wet day estimated in Exhibit 4.2 above is allocated to the projected dry weather diurnal flow of the Project on the same day between 20:00 and 23:00. When the combined volume of surplus flow (if any) and projected dry weather diurnal discharge from the Project exceeds the capacity of the new TPEPS allowed for TPSTW of 12,996 m3 per hour (see Section 4.5.4), the effluent would overflow into Tolo Harbour.
4.6.23 The hourly overflow rates under the “with Project” scenario are estimated for a complete year as shown in Exhibit 4.6 below.
Exhibit 4.6 Projected Hourly Overflow at Ultimate Design
Stage
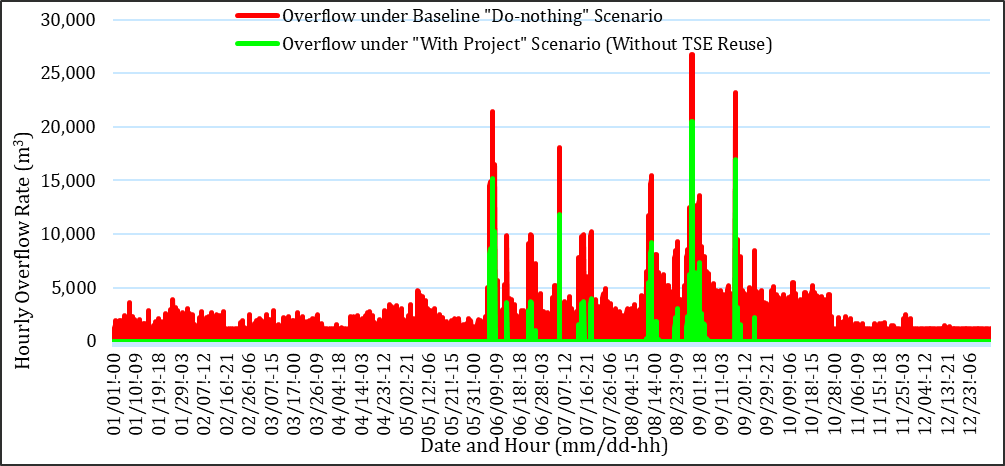
4.6.24 The hourly overflow estimated under the “do-nothing” scenario (as discussed in Sections 4.6.14 to 4.6.20 above) are included in Exhibit 4.6 for comparison. Under the “do-nothing” scenario, overflow would occur every day over the entire year with an annual overflow volume of 6,842,000 m3. Due to the THEES upgrading, the estimated annual overflow volume under the “with Project” scenario is much smaller and reduced to 632,000 m3 (i.e. reduced by 91% as compared to the baseline “do-nothing” scenario). Under the “with Project” scenario, overflow would occur occasionally on 30 days of a year only, and the occurrences would be scattered within the period June to September (in wet season). The overflow volumes estimated for the “do-nothing” scenario and the “with Project” scenario are presented in Table 4.12.
Table 4.12 Estimated
Overflow Quantities under Normal Operation
|
Scenario |
TSE Discharge of TPSTW (m3
per day) |
Design Capacity of TPEPS
Allowed for the Project (m3 per hour) |
Overflow Volume, June to September (Wet Season) (m3) |
Overflow Volume, Remaining Months (January
to May and October to December) (m3) |
Annual Overflow Volume (m3) |
|
Baseline “Do-nothing”
Scenario |
120,000 |
4,752 |
3,481,000 |
3,361,000 |
6,842,000 |
|
“With Project” Scenario |
160,000 |
12,996 |
632,000 |
0 |
632,000 |
|
Percentage Reduction of Overflow Volume: |
82% |
100% |
91% |
||
4.6.25 The overflow to Tolo Harbour in terms of the duration, annual volume and peak hourly rate would be greatly reduced in the future after commissioning of this Project and the THEES upgrading project (as compared to the baseline “do-nothing” scenario). Under the “with Project” Scenario, the total overflow volume within the period from June to September (wet season) would be significantly reduced by 82% as compared to the baseline “do-nothing” scenario. The overflow would be totally eliminated during the dry season. This Project would not cause any adverse water quality impact upon the Tolo Harbour under normal operation.
4.6.26 Overflow of treated effluent from the new CSTW would not arise under normal plant operation (see Section 4.5.3 to 4.5.5).
Treated Effluent Discharge to
Victoria Harbour under Normal Plant Operation
4.6.27 The Treated Sewage Effluent (TSE) from this Project and the new CSTW will be discharged to the Victoria Harbour via the THEES. The THEES effluent will be discharged to the KTR and then eventually to the KTAC. The design flow of this Project (i.e. 160,000 m3/day) is adopted for discharging to the Victoria Harbour WCZ, assuming that there would be no TSE reuse as a worst-case scenario.
THEES Maintenance Discharge to Tolo Harbour
4.6.28 Maintenance of the THEES tunnel may be required under the existing practice to ensure proper functioning and integrity of the tunnel. During the inspection or maintenance of the THEES tunnel, temporary suspension of the normal THEES operation with effluent bypass into the Tolo Harbour is unavoidable to provide a safe and dry zone within the THEES tunnel for the necessary inspection / maintenance works. The THEES maintenance discharge would only involve TSE.
4.6.29 During the THEES maintenance period, effluent bypass from the upgraded TPSTW would occur at the existing emergency outfall of TPSTW at Tai Po. Effluent bypass from the existing STSTW or the future CSTW would occur at the existing emergency submarine outfall in Sha Tin Hoi as shown in Figure 4.4. The effluent bypass from both the future upgraded TPSTW and the future CSTW during THEES maintenance period would be secondarily treated and disinfected. The key issues of concern would be the temporary increase in water pollution such as the increase of nutrients in Tolo Harbour.
4.6.30 Under the existing practice, regular inspection and maintenance of the THEES tunnel would be conducted when necessary, with duration of no more than 4 weeks each time based on past records. Thus, a 4-week THEES maintenance discharge period will be assumed in the water quality modelling. The frequency of the THEES maintenance would be no more than once every 5 years.
4.6.31 According to the latest information from Agriculture, Fisheries and Conservation Department (AFCD), the algae blooming season in Tolo Harbour would occur during the period from December to April/May. Hence, any future THEES maintenance, if required, would be scheduled outside the peak algae blooming season. (i.e. December to April/May). For water quality modelling purpose of this EIA, the 4-week THEES maintenance period will be assumed to occur in June and / or July outside the algae blooming season.
4.6.32 The design flow of this Project (i.e. 160,000 m3/day) is adopted as the daily Project discharge rate during the THEES maintenance period.
Emergency Discharge of
Partially Treated Sewage Effluent to Tolo Harbour
4.6.33 Water quality impact could arise from emergency discharge from this Project in case of power / plant failure. The key issues of concern would be the temporary increase in water pollution such as the depletion of oxygen and increase of nutrients and E. coli bacteria in Tolo Harbour.
4.6.34 Emergency discharge of sewage effluent from the future upgraded TPSTW, if any, would be discharged via the existing emergency outfall of TPSTW.
4.6.35 Based on the past discharge record of TPSTW, emergency sewage discharge had occurred only once since 1995 due to CLP power supply failure to TPSTW Stage IV inlet works. The duration of the emergency discharge from TPSTW was less than 3 hours with a total discharge volume of less than 9,000 m3. For modelling purpose of this EIA, emergency discharge from this Project is assumed to continuously occur for 3 hours.
4.6.36
In accordance with the
Environmental Permit (EP) of “TPSTW Stage V” obtained in 2004, dual power
supply or ring main supply from CLP, standby equipment and treatment units have
been provided for the existing TPSTW to prevent the occurrence of emergency
discharge. Since then, emergency discharge to Tolo Harbour from the existing
TPSTW had never happened again.
4.6.37 If dual power or ring main supply, standby equipment and treatment units are provided for this Project, the model assumption of total plant failure for a 3-hour period would be a very conservative scenario.
4.6.38 Mathematical modelling is conducted to simulate the impacts for emergency discharge centred at neap tide low water with the least water dispersion capacity. It is assumed that the sewage would be discharged in July during the wet season. Assuming a Project design flow of 160,000 m3/day, the total discharge volume over the 3-hour period would be about 20,000 m3. In case of power failure, the emergency discharge from the upgraded TPSTW would still be subject to settlement / sedimentation prior to the discharge and thus the quality of the emergency discharge is assumed to be similar to that of the primarily treated sewage effluent.
4.6.39 Concurrent emergency discharge from both TPSTW and STSTW had never occurred before. According to the EIA for “CSTW”, backup power supply, standby equipment and standby treatment units will also be provided for the future CSTW. Hence, plant failure from both the upgraded TPSTW and CSTW together is not expected and will not be further considered in this assessment.
Summary of Potential Impacts
from Treated Sewage Effluent
4.6.40 Sources of potential water quality impact associated with the Project effluent discharge during the operational phase are identified as follows:
n
Discharge of TSE from the Project to the Victoria Harbour via THEES under
normal plant operation;
n
Discharge of TSE from the Project to Tolo Harbour under THEES maintenance
event; and
n
Discharge of partially treated sewage from the Project to Tolo Harbour
under emergency situations.
Operational Phase –
Other Water Pollution Sources
4.6.41 Other sources of potential water quality impacts associated with the Project also include the following:
n
Possible spillage or rainwater wash off during transportation or handling
of the pre-treated food waste;
n
Wastewater generated from the sludge treatment / dewatering facility,
pre-treated food waste reception facility and the facility for co-digestion
of pre-treated food waste;
n
Non-point source surface run-off from the Project site; and
n
Possible spillage of chemicals (e.g. ferried chloride and polymer) during
the handling, storage and transferring of the chemicals.
4.7
Assessment Methodology
Construction Phase
4.7.1 The WSRs that may be affected by the Project have been identified. Potential sources of water quality impact that may arise during the construction of the Project were described. All the identified sources of potential water quality impact were then evaluated and their impact significance determined. The need for mitigation measures to reduce any identified adverse impacts on water quality to acceptable levels was determined.
Operational Phase –
Project Effluent Discharge
Modelling Tools
4.7.2 Computer modelling is used to assess the water quality impacts due to the partially treated/ treated or untreated sewage effluent discharge during the operational phase.
4.7.3 Delft3D suite of models, developed by Deltares, are used as the modelling platforms with the Deflt3D-FLOW module and the Delft3D-WAQ module used for hydrodynamic simulations and water quality simulations respectively. To simulate the potential impact from the Project on both Tolo Harbour and Victoria Harbour, two Delft3D models are adopted respectively:
n
Tolo Harbour and Mirs Bay (THMB) Model; and
n
Victoria Harbour (VH) Model.
4.7.4 Delft3D-FLOW is a 3-dimensional hydrodynamic simulation programme which calculates non-steady flow and transport phenomena that result from tidal and meteorological forcing on a curvilinear, boundary fitted grid.
4.7.5 Delft3D-WAQ is a water quality model tool for numerical simulation of various physical, biological and chemical processes including the sedimentation and sediment erosion processes in 3 dimensions. It solves the advection-diffusion-reaction equation for a predefined computational grid and for a wide range of model substances.
THMB Model
4.7.6 The THMB Model was developed by EPD under Agreement No. WP01-27 [8]. The model was fully calibrated and verified by comparing computational results with field measurements. The THMB model was subsequently accepted by EPD for directly use under the approved EIAs for “CSTW” and “TPSTW Stage V” for hydrodynamic and water quality modelling in Tolo Harbour. No changes to the model set up of the THMB Model such as the grid layout, model parameters and process coefficients are proposed. The grid layout and coverage of the THMB Model are shown in Appendix 4.2A.
VH Model
4.7.7 The VH Model is based on the model setup developed under Agreement No. CE 30/2008 (CE) as presented in the Water Quality Modelling Report [9] obtained from CEDD in 2020. The model was fully calibrated and verified with field measurement data. The same model setup was applied in the latest modelling submissions of KTD [10] obtained from CEDD as well as in the approved EIA for “CSTW” for hydrodynamic and water quality modelling in KTAC. The grid layout and coverage of the VH Model are shown in Appendix 4.2B.
Modelling Scenarios
4.7.8 The time horizon for water quality modelling would be at ultimate design stage (UDS) when the Project flow reaches the design capacity. The modelling scenarios include:
Discharge to Victoria Harbour
4.7.9 Scenario 1a - Baseline “Do-nothing” Scenario (Design Effluent Quality)
n Normal operation of TPSTW with an
ADWF of 120,000 m3/day to Victoria Harbour.
n Design effluent standards are applied to the ADWF for deriving the THEES loading.
4.7.10 Scenario 1b - “With Project” Scenario (Design Effluent Quality)
n Normal operation of the Project with an ADWF of 160,000 m3/day to Victoria Harbour.
n Design effluent standards are applied to the ADWF for deriving the THEES loading.
4.7.11 Scenario 2a - Baseline “Do-nothing” Scenario (Measured Effluent Quality)
n Same as Scenario 1a except that the 95th percentile effluent quality values from actual measurements were employed to derive the THEES loading.
n This is a more realistic worst-case scenario, see Note (6) under Table 4.13.
4.7.12 Scenario 2b - “With Project” Scenario (Measured Effluent Quality)
n Same as Scenario 1b except that the 95th percentile effluent quality values from actual measurements were employed to derive the THEES loading.
n This is a more realistic worst-case scenario, see Note (6) under Table 4.13.
Discharge to Tolo Harbour
4.7.13 Scenario 3 – Normal Project Operation
n Occasional overflow of TSE from the Project under normal operation as illustrated in Exhibit 4.6 and discussed in Section 4.6.22.
n Normal Project operation will not induce any water quality impact in Tolo Harbour, see Section 4.6.25. This scenario serves only as a baseline for comparison with the THEES maintenance and emergency discharge scenarios.
4.7.14 Scenario 4 - THEES Maintenance
n Discharge of THEES effluent (only TSE involved) into Tolo Harbour for 4 weeks (outside the algae blooming season), see Section 4.6.31.
n Maintenance discharge from the Project is assumed to be 160,000 m3/day (with no TSE reuse).
n Background Project discharge under Scenario 3 is adopted outside the THEES maintenance period.
4.7.15 Scenario 5 - Emergency Discharge
n Emergency discharge of primarily treated / settled effluent from the Project into Tolo Harbour under complete power / plant failure for 3 hours in wet season, see Section 4.6.38.
n The total emergency discharge would be about 20,000 m3.
n Background Project discharge under Scenario 3 is adopted outside the emergency discharge period.
4.7.16 Details of the modelling scenarios are presented in Table 4.13.
Table 4.13 Proposed
Water Quality Modelling Scenarios
|
Scenario |
Phase |
Effluent Flow |
Description |
Effluent |
BOD5 (mg/L) |
SS (mg/L) |
TKN (mg/L) |
TN (mg/L) |
NH3-N (mg/L) |
E. coli (no./100mL) |
|
Victoria Harbour |
||||||||||
|
1a (UDS) |
Baseline “do-nothing” scenario (design effluent
standards) |
120,000 m3/day (TPSTW) (1) +
340,000 m3/day (CSTW) |
· Interception and Pumping
(IP) Scheme is adopted to divert some water from KTR and KTAC to Kowloon Bay,
see Sections 4.5.13 to 4.5.17. · THEES loading based on design effluent standards of TPSTW and CSTW. |
TPSTW |
20 (2) |
30 (2) |
11.80 (3) |
20 (4) |
5 (4) |
1,000 (4) |
|
CSTW |
20 (5) |
30 (5) |
13.28 (5) |
20 (5) |
5 (5) |
1,000 (5) |
||||
|
1b (UDS) |
“With Project” Scenario (design effluent standards) |
160,000 m3/day (upgraded TPSTW) +
340,000 m3/day (CSTW) |
· IP Scheme is
adopted to divert some water from KTR and KTAC to Kowloon Bay, see Sections 4.5.13 to 4.5.17. · THEES loading based on design effluent standards of this Project and
CSTW. |
This Project |
20 (2) |
30 (2) |
11.80 (3) |
20 (4) |
5 (4) |
1,000 (4) |
|
CSTW |
20 (5) |
30 (5) |
13.28 (5) |
20 (5) |
5 (5) |
1,000 (5) |
||||
|
2a (UDS) |
Baseline “do-nothing” scenario (measured effluent
quality) |
120,000 m3/day (TPSTW) (1) +
340,000 m3/day (CSTW) |
· IP Scheme is
adopted to divert some water from KTR and KTAC to Kowloon Bay, see Sections 4.5.13 to 4.5.17. · THEES loading
input based on actual performance of TPSTW and STSTW (with the same treatment
level of this Project and CSTW) |
TPSTW |
6.60(6) |
14.25 (6) |
9.37 (6) |
14.08 (6) |
7.22 (6) |
1,000 (4) |
|
CSTW |
9.40 (5) |
20.15 (5) |
5.04 (5) |
17 (5) |
2.64 (5) |
1,000 (5) |
||||
|
2b (UDS) |
“with Project” Scenario (measured effluent quality) |
160,000 m3/day (upgraded TPSTW) +
340,000 m3/day(CSTW) |
· Use of IP Scheme
to divert some water from KTR and KTAC to Kowloon Bay, see Sections 4.5.13 to 4.5.17. · THEES loading
input based on actual performance of TPSTW and STSTW (with the same treatment
level of this Project and CSTW) |
This Project |
6.60(6) |
14.25 (6) |
9.37 (6) |
14.08 (6) |
7.22 (6) |
1,000 (4) |
|
CSTW |
9.40 (5) |
20.15 (5) |
5.04 (5) |
17 (5) |
2.64 (5) |
1,000 (5) |
||||
|
Tolo Harbour |
||||||||||
|
3
(UDS) |
Baseline Scenario (with no THEES maintenance and no
emergency discharge) |
Reduced Project overflow (as shown in Exhibit 4.6
above) was applied as the background discharge |
· Serves
as a baseline for comparison with Scenarios 4 and 5 to assist in identifying
the water quality impact from THEES maintenance and emergency situations. |
This
Project |
20 (2) |
30 (2) |
11.80 (3) |
20 (4) |
5 (4) |
1,000 (4) |
|
4 (UDS) |
THEES maintenance
|
During THEES Maintenance: 160,000 m3/day (from upgraded TPSTW) +
340,000 m3/day (from CSTW) Outside THEES Maintenance Period: Reduced Project overflow (as shown in Exhibit 4.6
above) was applied as the background discharge |
Temporary bypass of secondarily treated and
disinfected effluent from upgraded TPSTW and CSTW,
see Section 4.6.31. (for 4 weeks outside algae blooming season) |
This
Project |
20 (2) |
30 (2) |
11.80 (3) |
20 (4) |
5 (4) |
1,000 (4) |
|
CSTW |
20 (5) |
30 (5) |
13.28 (5) |
20 (5) |
5 (5) |
1,000 (5) |
||||
|
5 (UDS) |
Emergency discharge
|
Under Emergency Situation: 20,000 m3 per discharge event (from
upgraded TPSTW) Outside
Emergency Discharge Period: Reduced Project overflow (as shown in Exhibit 4.6
above) was applied as the background discharge |
Emergency bypass of primarily treated / settled
effluent from upgraded TPSTW, see
Section 4.6.38. (for 3 hours in wet season) |
This Project |
177 (7) |
174 (7) |
57 (7) |
58 (7) |
38 (7) |
2 x10⁷ (8) |
Notes:
(1) During EIA stage of the
“TPSTW Stage V”, the design capacity of TPSTW was proposed to be 130,000 m3/day.
The design capacity has been reviewed and changed to 120,000 m3/day
according to the latest operation information of TPSTW.
(2) At 95th percentile
value of the effluent standard (refer to Table 4.8). Using the 95th
percentile value as the effluent concentration for continuous discharge was
considered conservative, given that the effluent concentrations would be lower
than the 95th percentile value for most of the times.
(3) Based on the ratio
of TKN : Total N adopted in the approved EIAs for CSTW and TPSTW Stage V.
(4)
At mean value of the effluent standard (refer to Table
4.8). Unlike the WQO for DO which is a 10th percentile value,
the WQOs for TIN and UIA is an annual mean objective. The WQO for chlorophyll-a is a 5-day running averaged value. The
WQO for E. coli in Tolo Harbour is a
geometric mean objective. Thus, using the mean effluent standard in model
prediction is considered appropriate for comparison with the relevant WQOs. The
same approach has been adopted in the EIA for CSTW and the latest modelling
submissions of Agreement No. CE 30 /2008 (CE).
(5)
Based on the same effluent values adopted in the
approved EIA for CSTW.
(6) Based on maximum of
all moving yearly 95th percentile values from latest measurements of
effluents from TPSTW between January 2017 and July 2021. A yearly 95th percentile value is
defined as the 95th percentile value over a one-year period (e.g.
from 1 August 2020 to 31 July 2021). Use of the measured 95th percentile value
for continuous input is conservative. This represents a reasonable worst case for
impact assessment. The same approach is adopted in the EIA for CSTW as well as
under the latest 2020 modelling submissions of Agreement CE 30/ 2008 (CE).
(7) Maximum value of
monthly averaged data measured in primarily treated / settled effluent of TPSTW
(between 2017 and 2021).
(8) Typical design
concentrations adopted in the approved EIAs for CSTW and TPSTW Stage V.