3.4.4 The assessment heights at the representative ASRs in both construction dust impact assessment and operation phase impact assessment are up to the roof level of the existing buildings or planning parameter under the Revised RODP, including 1.5 metres Above Ground (mAG), 5 mAG, 10 mAG, 20 mAG, 40 mAG and/or 80 mAG, whichever are lower than the roof level of respective ASRs.
3.5 Identification and Description of Pollutant Sources
Construction Phase
3.5.1 Major construction works for the Project including all the 12 DPs that would include site clearance, site formation works, site development works, spoil handing activity at the work areas of the park, open space, community farm and amenity area, carriageways construction including utility installation, construction of sewage treatment works and sewage pumping station and associated facilities, drainage channel re-vitalisation, and stormwater drainage facilities. The construction activities dominantly contribute to construction dust impacts would include excavation, loading/unloading of spoils, material handling and wind erosion of exposed site area. The tentative working hours would be 07:00 to 19:00 from Monday to Saturday for all works sites. Based on the construction programme, rock crushing plants with capacity greater than 5,000 tonnes per annum and concrete batching plants with total silo capacity exceeds 50 tonnes would not be expected within the site. Blasting is not anticipated based on the current preliminary information. Based on the available information of the concurrent projects as presented in Section 2.12, the work sites of the concurrent projects with confirmed programme would not be located within 500 m assessment area during construction phase of the Project, therefore no cumulative dust impact from these concurrent projects as mentioned in Section 2.12 would be anticipated. Regarding the projects in the vicinity of the Project area but without the confirmed construction programme such as Tuen Mun Western Bypass (TMWB), its construction dust impact would not be considered in the assessment.
3.5.2 Apart from the above construction works, there would be some minor supporting works, including demolition works, pile removal, stormwater drain, and other improvement works for the Project. The potential dust impacts from these activities are localised and the extent of excavated areas would be limited.
3.5.3 Vehicular emission from the road traffic, emission from port back-up and logistics activities, industrial emission from chimney and nearby SPs are also the contributors to the cumulative construction dust impact.
Identification of Key Air Pollutants of Emission from Construction Activities
3.5.4 As mentioned above, major construction activities with significant particulate emission include excavation work, loading/unloading of spoils, material handling and wind erosion of exposed site area. On-site use of diesel-powered engines is the potential source for other gaseous pollutants such as NO2 and SO2 and smoke. The Air Pollution Control (Non-road Mobile Machinery) (Emission) Regulation came into effect in June 2015 to control emissions from diesel-powered engines. In addition, the number of such equipment required on-site will be limited and the equipment would be under normal operation with proper maintenance which is unlikely to cause significant smoke and gaseous emissions. Thus, particulates from construction activities would be the major air pollutant during construction phase. According to Annex 4 of the EIAO-TM, Total Suspended Particulates (TSP) is the criteria pollutant for construction dust impact assessment. Quantitative assessment of TSP emission impact as well as other particulates, Respirable Suspended Particulates (RSP) and Fine Suspended Particulates (FSP) stipulated in AQOs, is conducted for assessing construction dust impact due to the Project.
Operation Phase
3.5.5 Four major types of air pollution sources have been identified within the assessment area. The first source is vehicular exhaust from the road traffic within 500 m assessment area of the Project including DP1, DP2, DP5, DP6, and DP12, and existing roads including Yuen Long Highway, KSWH, and Castle Peak Road. The locations of all DP roads and existing roads are shown in Figure 2.1.
3.5.6 The second source is emission from port back-up and logistic activities at the New Container Back-up and Storage Area (DP7) planned at the north-west part of the Project area adjoining KSWH that can facilitate readily available cross boundary connectivity. As mentioned in Section 2.5, the existing brownfield operations in HSK area has created considerable environmental problems. The provision of a dedicated area for port back-up, storage and workshop uses would accommodate some of the existing brownfield operation so as to alleviate existing industrial/residential interface issues resulting from existing container storage and port back-up areas. Since new roads will be provided to directly connect this area to KSWH, it would eliminate the current movement of heavy good vehicles through built-up areas so as to reduce the vehicular emission impact on the air sensitive uses within the Project area.
3.5.7 The third source is emission from industrial chimneys, including the factories, concrete batching plants, crushing plant and asphalt plant operating under the Specified Processes (SP) licenses. Based on the latest chimney survey information collected in end 2015, these chimneys are located within existing villages, while some others are located at the existing factory buildings within Project area. Some major SP, such as crushing plant and asphalt plant are located at the Lam Tei Quarry, which would be terminated before the 1st population intake before 2024. Some existing concrete batching plants within the Project area are required to be removed due to the Project. For air quality impact assessment purpose, an industrial zone planned at the western fringe of the Project near KSWH has assumed for locating three new concrete batching plants. Since new roads will be provided to directly connect this site to KSWH and Road P1, it would avoid the movement of the trip generation from the concrete batching plants through built-up areas so as to reduce the potential vehicular emission impact on the ASRs within the Project area.
3.5.8 The fourth source is odour from the chicken farm, planned refuse transfer station (RTS) (DP11), new HSK sewage treatment works (STW) (DP8), 4 new sewage pumping stations (SPS) (DP9) and existing San Wai STW. The planned RTS and HSK STW would be located next to the existing San Wai STW which is planned to be expanded and upgraded. The new HSK STW and the planned RTS are planned at the north-west fringe of the Project which are located far away from the residential developments and educational institutes to avoid the potential odour impact. Cumulative odour impact would be expected on the nearby planned port back-up and logistic facilities. The chicken farm is an existing facility located at about 200 m southwest of Fung Kong Tsuen (historic village) which may have potential odour impact on the nearby New Container Back-up and Storage Area. The four new SPSs which would be located at different areas within the Project area may have potential odour nuisances to the nearby ASRs.
Identification of Key/Representative Air Pollutants of Vehicle Emissions from Open Road
3.5.9 Vehicular emission comprises a number of pollutants, including Nitrogen Oxides (NOx), RSP, FSP, Sulphur Dioxides (SO2), Carbon Monoxide (CO), Lead (Pb), Toxic Air Pollutants (TAPs), etc. According to “An Overview on Air Quality and Air Pollution Control in Hong Kong” [[2]] published by EPD, one of the major air pollution issues is the local street-level pollution. Diesel vehicles are the main source of street-level pollution. The levels of suspended particulates (RSP/FSP) and nitrogen dioxide (NO2) at the roadside in Hong Kong have been exceeded the Air Quality Objectives over the years. Motor vehicles, especially diesel vehicles, are the main sources of these pollutants at street level in Hong Kong. For other pollutants such as Diesel Particulate Matters (DPM), Polycyclic Aromatic Hydrocarbons (PAHs) and Volatile Organic Compounds (VOCs), due to the low concentration in vehicular emission, they are not considered as key pollutants for the purpose of this study.
3.5.10 Nitrogen oxides (NOx) is a major pollutant from fossil fuel combustion. According to the 2014 Hong Kong Emission Inventory Report published by EPD, marine vessels and public electricity generation are the largest NOx emission sources and accounted for 33% and 33% of the total emission in 2014, respectively. Vehicles were also a major NOx emission source, accounting for 19% of the total.
3.5.11 In the presence of O3 and VOC, NOx would be converted to NO2. Increasing traffic flow would inevitably increase the NOx emission and subsequently the roadside NO2 concentration. Hence, NO2 is one of the key pollutants for the operational air quality assessment of the Project. 1-hour and annual average NO2 concentrations at each identified ASRs would be assessed and compared with the relevant prevailing AQOs to determine the compliance.
3.5.12 Respirable Suspended Particulates (RSP) refers to suspended particulates with a nominal aerodynamic diameter of 10µm or less. According to the 2014 Hong Kong Emission Inventory Report published by EPD, marine vessels became the largest RSP emission source and accounted for 36% of the total emissions in 2014. Public electricity generation and non-combustion sectors are the 2nd and 3rd major RSP emission sources, accounting for 17% and 15% of the total emission in 2014.
3.5.13 Increasing traffic flow would inevitably increase the roadside RSP concentrations. Hence, RSP is a key pollutant for the operational air quality assessment of the Project. The 24-hour and annual average RSP concentrations at each identified ASR would be assessed and compared with the relevant prevailing AQO to determine the compliance.
3.5.14 Fine Suspended Particulates (FSP) refers to suspended particulates with a nominal aerodynamic diameter of 2.5µm or less. According to the 2014 Hong Kong Emission Inventory Report published by EPD, navigation became the largest FSP emission source and accounted for 42% of the total emissions in 2014. Road transport is also a major FSP emission source, accounting for 17% of the total emission in 2014.
3.5.15 Similar to the RSP, increasing traffic flow would increase the roadside FSP. Hence, FSP is also a key pollutant for the operational air quality assessment of the Project. The 24-hour and annual averaged FSP concentrations at each identified ASR would be assessed and compared with the relevant prevailing AQO to determine the compliance.
3.5.16
Sulphur dioxide (SO2) is formed primarily from the combustion of sulphur-containing
fossil fuels. In Hong
Kong , power stations and marine vessels are the major sources of
SO2, followed by fuel combustion equipment and motor vehicles.[[3]]
SO2 emission from vehicular exhaust is due to the sulphur
content in diesel oil. According to
the 2014 Hong Kong Emission Inventory Report released by EPD, SO2
emissions from vehicles had been substantially reduced (<1% of total) after
the introduction of Euro V diesel from December 2007, whose sulphur content are
capped at 0.001%. Similarly,
industrial sector and construction had been using Euro V diesel since
2009. Starting from 1 October 2008,
sulphur content of liquid fuel shall not exceed 0.005% for commercial and
industrial process, according to the Air Pollution Control (Fuel Restriction)
(Amendment) Regulation (the “Amendment Regulation”).
3.5.17 In view that road transport only contributes a very small amount of SO2 emission, relatively low measured concentrations and the adoption of low-sulphur and ultra-low-sulphur fuel under the existing government policy, SO2 would not be a critical air pollutant of concern.
3.5.18 Carbon Monoxide (CO) is a typical pollutant emitted from fossil fuel combustion and comes mainly from vehicular emissions. With reference to the “Air Quality in Hong Kong 2014”[[4]], the highest 1-hour average (3,590 µg/m3) and the highest 8-hour average (2,609 µg/m3) CO concentrations were both recorded at the Central and Mong Kok roadside stations; these values were around one eighth and one fourth of the respective AQO limits. In view that there is still a large margin to the AQOs, CO would not be a critical air pollutant of concern.
3.5.19 Ozone (O3) is produced from photochemical reaction between NOx and VOCs in the presence of sunlight, which will not be generated by this Project. Concentration of O3 is governed by both precursors and atmospheric transport from other areas. When precursors transport under favorable meteorological conditions and sunlight, ozone will be produced. This explains why higher ozone levels are generally not produced in the urban core or industrial area but rather at some distance downwind after photochemical reactions have taken place. In the presence of large amounts of NOx in the roadside environment, O3 reacts with NO to give NO2 and thus results in O3 removal. O3 is therefore not considered as a key air pollutant for the operational air quality assessment of a road project.
3.5.20
Lead (Pb) is not considered as a critical air pollutant of concern. The sale
of leaded petrol has been banned in Hong Kong
since April 1999. According to the
“Air Quality in Hong Kong 2014”, the overall 3-month averages were ranging from
29 ng/m3 (at Central/Western, Kwai Chung and Mong Kok) to 35 ng/m3
(Yuen Long). The measured concentrations were well below the AQO limits of 500
ng/m3.
3.5.21 Toxic Air Pollutants (TAPs) is a type of the pollutants found in vehicular exhaust, which are known or suspected to cause cancer or other serious health and environmental effects. With reference to EPD’s Assessment of Toxic Air Pollutant Measurements in Hong Kong Final Report [[5]], monitored TAPs in Hong Kong include diesel particulate matters (DPM), toxic elemental species, dioxins, polychlorinated biphenyls (PCBs), polycyclic aromatic hydrocarbons (PAHs), carbonyls, and volatile organic compounds (VOCs). According to the results of Assessment of Toxic Air Pollutant Measurements in Hong Kong Final Report and Sources of PCB emissions [[6]], vehicular emission is not considered as primary source of dioxins, PCBs, carbonyls and most toxic elemental species in Hong Kong. Therefore, these pollutants are not considered as key pollutants for quantitative assessment for the operation phase of a road project.
3.5.22 Diesel Particulate Matters (DPM), as part of the overall Respirable Suspended Particulates (RSP), is one of the most important parameter contributing to the overall health risk of the population. Local vehicular emission is one of the major sources of DPM.
3.5.23 EPD has embarked on the following three key programmes to reduce the diesel particulate level at the roadside [[7]]: (a) the LPG taxi and light bus program; (b) the introduction of an advanced test to check diesel vehicle smoke emission; and (c) the retrofit of pre-Euro diesel commercial vehicles with diesel oxidation Catalysts (DOCs). According to EPD’s website [[8]], franchised bus companies have also retrofitted their Euro I buses with diesel oxidation catalysts (DOCs) and Euro II and III buses with diesel particulate filters (DPFs). A DPF can reduce particulate emissions from diesel vehicles by over 80%.
3.5.24 As recommended by EPD’s Assessment of Toxic Air Pollutant Measurements in Hong Kong Final Report, elemental carbon (EC) is used as a surrogate for DPM, and with reference to Measurements and Validation for the 2008/2009 Particulate Matter Study in Hong Kong [[9]], EC showed a significant decrease in concentration from 2001 to 2009 in Hong Kong, i.e. -47.5%, -30.0% and -28.3% at Mong Kok, Tsuen Wan and Hok Tsui Monitoring Sites, respectively. With the continual efforts by EPD to reduce particulate emission from the vehicular fleet, a discernible decreasing trend is noted in the level of particulate matter. Therefore, DPM is not selected as representative pollutant for quantitative assessment for this project.
3.5.25 Polycyclic Aromatic Hydrocarbons (PAHs) are organic compounds of two or more fused benzene rings, in linear, angular or cluster conformations. Local vehicular traffic is also an important source of PAHs. For this group, the most important PAH is Benzo[a]pyrene, and it is often selected as a marker for the PAHs[[10]]. The EU Air Quality Standards for PAHs (expressed as concentration of Benzo[a]pyrene) is 1 ng/m3 for annual average[[11]]. With reference to “Air Quality in Hong Kong 2014”, annual average concentrations of PAHs (Benzo[a]pyrene) measured at EPD’s TAP monitoring stations (Tsuen Wan and Central/Western) were 0.16 ng/m3 and 0.13 ng/m3, which is far below the EU Standards. Thus, PAHs are not considered as key pollutants for quantitative assessment for this project.
3.5.26 Volatile Organic Compounds (VOCs) are of great concern due to the important role played by them in a range of health and environmental problems. The US EPA has designated many VOC, including those typically found in vehicular emission, as air toxics. According to Assessment of Toxic Air Pollutant Measurements in Hong Kong Final Report, 2003, among the VOC compounds, benzene and 1,3-butadiene are the most significant ones for Hong Kong. The UK Air Quality Standards for benzene and 1,3-butadiene are 5.0 µg/m3 and 2.25 µg/m3 respectively[[12]]. Accordingly to “Air Quality in Hong Kong 2014”, annual average concentrations of benzene at EPD’s TAP monitoring stations were 1.31 µg/m3 (Central/Western) – 1.47 µg/m3 (Tsuen Wan), respectively. The levels of 1,3-butadiene were 0.05 µg/m3 and 0.08 µg/m3 for Central/Western and Tsuen Wan districts respectively. They are far below the UK Standards. Thus, VOCs are not considered as key pollutants for quantitative assessment for this project.
Identification of Key/Representative Air Pollutants of Ports Back-up and Logistics Activities
3.5.27 The operations for port back-up and logistics activities would generally include container storage, goods dispatching and logistic activities, and vehicle movement. Such operations would mainly involve on-road and off-road vehicles. It is anticipated that the key pollutants would be the same as that for the open road vehicular emission. Thus, NO2, RSP and FSP would be the key concerns. The locations of the emission sources of port back-up and logistics activities are shown in Appendix 3.2.
Identification of Key/Representative Air Pollutants of Chimneys and Specified Processes
3.5.28 There are some chimneys located within or in the vicinity of the Project. All installation or alteration of fuel-burning equipment and chimney is controlled under the Air Pollution Control (Furnaces, Oven & Chimneys) (Installation & Alteration) Regulations. The key pollutants generated from combustion activities would be NO2 and SO2. The locations of these existing chimneys are shown in Appendix 3.2.
3.5.29 Similarly, any industrial activities which involve certain polluting industrial processes known as "Specified Processes" (SP) would be controlled under the Air Pollution Control Ordinance. Through the terms and conditions of the SP licence, the owners of the premises used for the conduct of specified processes are required to use the Best Practicable Means (BPM) to prevent air pollution. The key pollutants induced from the SP within the assessment area have been extracted from the EPD licensing records.
3.5.30 Four existing concrete batching plants (also controlled under SP) within the Project area are required to be removed to make way for the necessary developments under the Project. For air impact assessment purposes, Site 3-47, which is at the western portion next to the northern portal of the TMWB, has assumed for locating three new concrete batching plants in future. Under the latest BPM for concrete batching plant, the new batching plant will be under a tighter emission control with the point source emission concentration limit of 10 mg/m3 for particulates (rather than the previous 50 mg/m3) starting from 1st January 2018. The tentative locations of the three concrete batching plants at Site 3-47 are shown in Appendix 3.2.
Identification of Key/Representative Air Pollutants of Existing Chicken Farm, Planned RTS, Upgraded Sai Wai STW, New HSK STW and New Sewage Pumping Stations
3.5.31 The existing chicken farm, planned RTS, upgraded Sai Wai STW and new HSK STW (DP8) would cause potential odour impact to the Project sites. As the planned RTS and new STWs are newly planned facilities, their odour emission can be easily abated by design, i.e. to be equipped with odour control technology such as deodorising units. The potential odour sources of the upgraded Sai Wai STW would also be enclosed and the vented air would be treated in the deodorising unit according to the approved EIA Report of “Upgrading and expansion of San Wai Sewage Treatment Works and expansion of Ha Tsuen Pumping Station”. However, the existing chicken farm may not have adequate odour abatement by design and would pose potential odour impact on the planned sites in the Project area. The odour impacts due to existing chicken farm, RTS and the sewage treatment facilities are assessed in this EIA study. The location of the existing chicken farm is shown in Appendix 3.6 while the locations of the Sai Wai STW, new HSK STW and planned RTS are indicated a figure attached in Appendix 3.8.
3.5.32 Four new SPS (DP9) would be constructed at Sites 2-34, 3-41, 3-48 and 4-35 to convey the existing sewage flow to San Wai STW and new sewage flow to the new HSK STW. The locations of these SPSs are indicated in Figure 1.3. The design capacity of the SPS at Site 2-34 (SPS1), Site 3-41 (SPS2), Site 3-48 (SPS3) and Site 4-35 (SPS4) would be 27,000 m3 per day, 39,500 m3 per day, 11,000 m3 per day and 68,000 m3 per day, respectively. It may have potential odour nuisance during operation of SPSs. However, the odorous facilities of these four SPSs would be enclosed and designed with the provision of deodourisers to treat the exhausted gas, insignificant odour impact from the operation of the SPSs would be anticipated.
3.5.33 The refuse collection vehicles should be of fully-enclosed type to avoid odour spread. In addition, the designed route for the refuse collection vehicle to/from the RTS would be via Road P1 and then Road D1 so as to minimise the potential odour impact from these vehicles to the ASRs within the Project area. The drivers of refuse collection vehicles (RCV) should follow the procedures for cleaning of the RCV in accordance with Code of Practice on the Operation of Refuse Collection Vehicles issued by EPD and Transport Department so as to keep the RCV in a clean and hygienic condition. Therefore, no adverse odour nuisance would be expected from the operation of RCVs.
3.6 Assessment Approach and Methodology (Construction Phase Dust Impact)
General Approach
3.6.1 According to “Guidelines on Assessing the ‘TOTAL’ Air Quality Impacts”, three components of contribution should be considered in evaluating the air quality impact due to the Project upon ASRs, namely primary, secondary and background contributions.
Primary Contributions
3.6.2 Primary contributions are the project-induced emission which contributes to the local air quality impact. Thus, construction dust emission associated with the construction works of the Project is the primary contributions during the construction phase.
3.6.3 Construction activities with significant particulate emission are identified from the construction method suggested by engineering design. Construction dust impact is predicted based on emission factors from US Environmental Protection Agency (USEPA) Compilation of Air Pollution Emission Factors (AP-42), 5th edition and activity data from the engineer design. The major dusty construction activities for the Project to be concerned and considered in the modelling assessment include:
· Site Formation Works for all planned developments within the Project area including all DPs
Excavation and material handlings within the construction site modelled as heavy construction activities
Spoil handling activity at the work areas of the park, open space, community farm and amenity area (Spoil handling activity is considered in Tier 2 and Tier 3 assessment to reflect the work areas with minor excavation works and spoil loading/unloading.)
Wind erosion of open active site during non-working hours
· Carriageway construction including Road P1 (DP1), Road D1 - D8 (DP2), DP5, DP6 and DP12
Excavation, material handlings and backfilling within the construction site modelled as heavy construction activities
Wind erosion of open active site during non-working hours
3.6.4 Works activities and plant would not be concentrated in certain areas of the site close to ASRs for an extended period of time during the construction period. However, notwithstanding that such a scenario would not be expected to occur, a hypothetical Tier 1 screening test assuming 100% active area of construction site of the Project with mitigation measures in place has been undertaken for predicting hourly average TSP, daily average RSP and FSP levels. It aims to highlight the hot spot locations where construction dust may potentially become an issue. However, it should be emphasised that Tier 1 screening test is a hypothetical one which is very conservative and does not occurred in reality.
3.6.5 A tier results have allowed a more focused next tier assessment to be undertaken at the specific hot spot locations where TSP/RSP/FSP non-compliance is predicted under the Tier 1 screening test. A focused next Tier assessment, Tier 2, is undertaken whereby monthly average works areas of the concurrent work contracts according to the construction work programme are considered as active work areas in the assessment. The monthly average works areas per works contract is depending on the total work area and its construction period of its works contract. The calculation of the monthly average works areas of each works contract is presented in Appendix 3.1. The locations of the works contracts are shown in the Development Phasing Plan as attached in Appendix 3.13. In Tier 2 assessment, the active work areas of concurrent work contracts are positioned closest to the potentially worst affected ASRs, and the individual affected ASR would be influenced by one active work area of each concurrent work contract. Hoarding is erected along the construction site boundary adjacent to the non-construction areas such as residential, educational institutes or recreation area in use so as to minimise the dust impact. When the active works areas are positioned where hoarding is erected, dust emission height is increased to 3 meters above ground. The relevant arrangement is further discussed in Section 3.10.3 and Section 3.10.9.
3.6.6 For the ASRs which would still be adversely affected by the construction works under Tier 2 assessment, a Tier 3 assessment would be conducted with further limitation of size of the active work area of the work contract closest to the affected ASR to one third of monthly average work area of the work contract. The limitation of the active work area in Tier 2 and Tier 3 assessment is workable as confirmed by the Engineer, and would be implementation by means of contract management. Dust emission height is increased to 3 meters above ground when hoarding is erected at the construction site boundary adjacent to the non-construction areas as discussed in Section 3.6.5.
3.6.7 In terms of the annual average prediction, the highest percentage active work area is less than 10% during any short period of time based on the engineers’ estimation. It is assumed that 10% of hourly/daily assessment emission rates are adopted for the long-term annual predictions for RSP/FSP in both assessment scenarios.
3.6.8
The impact of fugitive dust
sources on air quality depends upon the quantity as well as the drift potential
of the dust particles emitted into the atmosphere. Large dust particles (i.e. over 100 mm in diameter) would settle out near the source and particles that
are between 30 and 100 mm in diameter are likely to undergo impeded settling. The major dust impacts are likely to
arise from particles less than 30 mm in diameter, which have a greater potential to disperse over
greater distances.
3.6.9 According to United States Environmental Protection Agency (USEPA) AP-42[[13]], construction dust particles may be grouped into five particle size classes. The particle size distribution as referenced to AP-42, Section 13.2.4 (Aggregate Handling Emission), is normalised to obtain the particle size distribution in PM30 (TSP). Details are shown in Table 3.7. The mass of RSP, which is defined as suspended particulates in air with aerodynamic size of 10 µm or smaller, is estimated to be 47.3% of PM30, i.e. RSP emission = 47.3% × TSP emission. Similarly, the mass of FSP is estimated to be 7.2% of PM30.
Table 3.7 Particle Size
Distribution
|
Size
Range (µm) |
Average
size(µm) |
Distribution |
Normalized
Distribution |
|
15 – 30 |
22.5 |
26% |
35% |
|
10 – 15 |
12.5 |
13% |
18% |
|
5 – 10 |
7.5 |
15% |
20% |
|
2.5 – 5 |
3.75 |
15% |
20% |
|
< 2.5 |
1.25 |
5% |
7% |
3.6.10 According to the preliminary engineering design information, dust control measures have been incorporated into the design, as presented in Table 3.8. These dust control measures have also been taken into account in the assessment.
Table 3.8 Dust Emission Design
Control Measures
|
Process |
Description |
Dust
Emission Design Control Measures |
|
Haul
road within construction sites facilities |
Transportation
of spoil |
All
road surfaces within the construction sites would be paved and watering
frequently along the haul road during the working hours. |
|
Unloading
of materials |
Unloading
of spoil materials |
The
unloading process would be undertaken within a 3-sided screen with top
tipping hall. Water spraying and
flexible dust curtains would be provided at the discharge point for dust
suppression. |
|
Trucks |
Vehicles
leaving the loading/unloading facility |
Vehicles
would be required to pass through the wheel washing facilities provided at
the site exit. |
3.6.11 Details of emission factors of dusty construction activities are given in Table 3.9. The detail calculation of dust emission rates is presented in Appendix 3.1. The development phasing plan is attached in Appendix 3.13.
Table 3.9 Emission Factors for Dusty Construction Activities
|
Source |
Activity |
Emission
Factor |
Remarks
|
|
Site formation work or
Carriageway construction |
Heavy Construction Activities |
E(TSP)=2.69 Mg/hectare /month of activity E(RSP) = 2.69
x 47.3% Mg/hectare/month
[1] E(FSP) = 2.69 x 7.2% Mg/hectare/month [1] |
100% area actively operating
for hourly and daily concentration prediction 10% area actively operating for
annual concentration prediction AP-42, Section 13.2.3, 1/95 ed. |
|
Wind Erosion |
E(TSP)=0.85
Mg/hectare /year E(RSP) = 0.85
x 47.3% Mg/hectare/month [1] E(FSP) = 0.85 x 7.2% Mg/hectare/month [1] |
100% area actively operating
for hourly and daily concentration prediction 10% area actively operating for
annual concentration prediction AP-42, 5th ed.,
Table 11.9.4 |
|
|
Work Area at Park, Open
Space, Community Farm and Amenity Area (For Tier
2 and 3 Assessment only) |
Spoil Handling Activity |
E(TSP) = 0.00076 kg/Mg E(RSP) = 0.00076 x 47.3% kg/Mg E(FSP) = 0.00076 x 7.2% kg/Mg |
100% area actively operating
for hourly and daily concentration prediction AP42, Section 13.2.4 |
|
Wind Erosion |
E(TSP)=0.85
Mg/hectare /year E(RSP) = 0.85
x 47.3% Mg/hectare/month [1] E(FSP) = 0.85 x 7.2% Mg/hectare/month [1] |
100% area actively operating
for hourly and daily concentration prediction AP-42, 5th ed., Table 11.9.4 |
Remarks:
[1]
USEPA AP-42, 5th ed. 11/06 ed. S13.2.3
3.6.12 For the prediction of the highest hourly average TSP, the 10th highest daily average and annual average RSP and FSP concentrations, 12-hour (07:00-19:00) per day, 7 days a week is assumed for the construction period in the assessment. Only wind erosion is assumed for other non-working hours (19:00 to 07:00 of the following day).
Secondary Contributions
3.6.13 Secondary contributions are the air pollutant emissions in the immediate neighborhood of the Project Site contributing further to the local air quality impact. Any particulates emission sources within 500 m of the Project boundary with notable impact shall be identified and considered in the construction phase impact assessment. The secondary contribution in particulates comes from the vehicular emission and industrial emissions within and in the vicinity of the Project area. The details of the emission inventories of the vehicular traffic and industrial sources refer to Section 3.7. Based on the available information of the concurrent projects as presented in Section 2.12, the work sites of the concurrent projects with confirmed programme would not be located within 500 m assessment area during construction phase of the Project, therefore no cumulative dust impact from these concurrent projects would be anticipated. Regarding the projects in the vicinity of the Project but without the confirmed construction programme (e.g. TMWB), its construction dust impact would not be considered in the assessment as the relevant engineering information is unavailable.
Background Contributions
3.6.14 As suggested by “Guidelines on Assessing the ‘TOTAL’ Air Quality Impacts”, an integrated modelling system, Pollutants in the Atmosphere and their Transport over Hong Kong model (PATH-2016) which is developed and maintained by EPD is applied to estimate the background pollutant concentrations. The details of the background concentrations for the assessment area refer to Section 3.7.
Determination of the Assessment Year
3.6.15 Referring to the construction programme as presented in Appendix 2.4, the construction work is targeted to commence in Year 2019 and be completed by Year 2038. For these 19-years construction period, the construction works in the Project area would be generally divided into five stages work contracts:
· Advance Works (Year 2019 – 2029)
· Stage 1 Works (Year 2022 – 2025)
· Stage 2 Works (Year 2026 – 2031)
· Stage 3 Works (Year 2031 – 2035)
· Stage 4 Works (Year 2031 – 2038)
3.6.16 A review is conducted on the tentative construction and implementation programme, as presented in Appendix 3.13. Advance Works, Stage 1 Works and Stage 2 Works contracts would be commenced in Year 2019, Year 2022 and Year 2026, respectively. These three stages work contracts would be overlapped and all dusty construction activities would be completed by Year 2030 (while the completion date of Stage 2 Works is in Year 2031, all the site formation works, which are dust generating activities, would be completed by Year 2030. Hence, for construction dust assessment purpose, Stage 2 Works are included in Scenario 1 in Table 3.10 below only). Stage 3 Works and Stage 4 Works contracts would be commenced in Year 2031 and would be completed by Year 2035 and Year 2038, respectively. While the completion date of Stage 4 Works is in Year 2038, all the site formation works, which are dust generating activities, would be completed by Year 2036. For construction dust assessment purpose, Scenario 2 is up to Year 2036. Therefore, the construction dust impact assessment is divided into two assessment scenarios, “Year 2019 – Year 2030” Scenario for Advance Works, Stage 1 Works and Stage 2 Works contracts and “Year 2031 – Year 2036” Scenario for Stage 3 Works and Stage 4 Works contracts. Both assessment scenarios are based on the conservative assumptions as mentioned in Table 3.10 to determine the worst construction dust impact on the representative ASRs over the whole construction period.
Table 3.10 Assumption for Two Construction Dust Assessment Scenarios
|
Scenario |
Justification |
Work Site Area & ASRs Considered in the
Assessment |
|
Scenario 1: Year 2019 – Year 2030 |
A few development sites under Advance Works, Stage 1 Works and Stage 2
Works would commence the site formation works during Year 2019 – 2025, but a
number of development sites would commence the site formation works in Year
2026. All works under Advance Works,
Stage 1 Works and Stage 2 Works would be completed by Year 2031. As a conservative approach, assume all development sites under Advance
Works, Stage 1 Works and Stage 2 Works undertaking the site formation works
concurrently in the assessment except Sites 2-18, 2-19, 3-6, 3-7, 3-8, 4-20,
part of 5-24 and 5-26. As the
site formation of these sites would be completed in Year 2021 – Year 2026,
these sites are considered as ASRs in the assessment. The intake year of Site 5-32 would be
by Year 2030, therefore, this site is considered as construction dust source
and the dust impact on this site is addressed in Scenario 2. |
All development sites (work sites under Advance
Works, Stage 1 Works and Stage 2 Works) undertaking site formation works
during Year 2019 –2030 are assumed to be conducted concurrently. All representative existing ASRs and planned ASRs
occupied between Year 2019 – 2030 are considered in the assessment, except
the ASRs which would intake at end Year 2030 would be considered in Scenario 2:
Year 2031 – 2036. The locations of the ASRs and the work site area
considered in the model are shown in Figure
3.2. |
|
Scenario 2: Year 2031 - 2036 |
A number of development sites under Stage 3 Works and Stage 4 Works
would commence the site formation works since Year 2031 and all these site formation works would be completed by Year 2036. As a conservative approach, assume all development sites under Stage 3
Works and Stage 4 Works undertaking the site formation works concurrently in
the assessment. |
All development sites (work sites under Stage 3
Works and Stage 4 Works) undertaking site formation works during Year 2031 –
2036 are assumed to be conducted concurrently. All representative existing ASRs and planned ASRs
occupied before Year 2036 within the Project area are considered in the
assessment. The locations of the ASRs and the work site area
considered in the model are shown in Figure
3. 3. |
3.6.17 The cumulative emission sources considered in these two scenarios are listed in Table 3.11 and Table 3.12, respectively. As mentioned in Section 3.5.1, the construction programme for TMWB is not available at the time of the assessment, its construction dust impact would not be considered in the assessment, however, its operation phase vehicular emission impact would be considered in the assessment since Year 2031.
Table 3.11 Cumulative Dust Emission Sources in Scenario 1: Year 2019-2030
|
Emission |
Cumulative Dust
Sources |
|
Construction Dust |
Dust sources from Advance Works, Stage 1 Works
and Stage 2 Works |
|
Open Road Traffic |
·
With a section of Road P1 (DP1), a section of Road D1 (DP2),
junction of D8/P1 (DP5) connecting ”PBU+SWU”, and all existing roads within
500 m assessment area. The locations
of the roads considered in the model refer to Appendix
3.4. ·
Traffic
data: Year 2026 ·
Vehicular
emission factor: Year 2026 (There is no new road opening under
the Project until Year 2024, therefore traffic before Year 2024 is
irrelevant for study. Referring to the emission burden calculation as shown
in Table 3.20, Year 2026 is
considered the worst emission burden year between Year 2024 and Year 2030. Thus traffic flow and emission factor of Year
2026 are used.) |
|
Industrial Emissions |
·
Existing
chimneys and SPs within 500 m assessment area ·
3 new concrete batching
plants (CBPs) and 2
relocated chimneys within the Project area ·
Non-road
mobile source from ”PBU+SWU” at Site 3-6, 3-7 & 3-8 |
Table 3.12 Cumulative Dust Emission Sources in Scenario 2: Year
2031-2036
|
Emission |
Cumulative Dust
Sources |
|
Construction Dust |
Dust sources from Stage 3 Works and Stage 4 Works |
|
Open Road Traffic |
·
All
existing roads within 500 m assessment area and planned roads including all
DP roads within the Project area. The locations of the roads considered
in the model refer to Appendix 3.4. ·
Traffic
data: Year 2036 (which has considered
the traffic flow of all DPs roads) ·
Vehicular
emission factor: Year 2031 (Year 2031 is the highest emission factor but it covers parts of new roads
within the Project area only. In
Year 2036, all new roads within the Project area including all DP roads would
be open, therefore, the NOx emission burden is
calculated based on Year 2036 traffic flow and Year 2031 emission
factor. The NOx, RSP and FSP
emission burden based on Year 2036 traffic flow and Year 2031 emission factor
would be 233.2, 8.728 and 8.114 tonnes per annum, higher than the emission
burden in any year from Year 2031 to 2039 as shown in Table 3.20) |
|
Industrial Emissions |
·
Existing
chimneys and SPs within 500 m assessment area ·
3 new CBPs and 2 relocated chimneys within the Project
area ·
Non-road
mobile source from ”PBU+SWU” at Site 3-1 to 3-14 ·
Boiler from
the proposed hospital |
|
Portal Emission and Ventilation Building |
TMWB |
Dispersion Modelling & Concentration Calculation
3.6.18 AERMOD, Gaussian dispersion model recommended by HKEPD, is adopted to assess the potential primary dust impact from the construction works and secondary ones due to industrial/chimney emissions. Assessment heights up to the roof level of the respective ASRs are adopted for the construction dust impact assessment.
3.6.19 CALINE4, the EPD approved line source air dispersion model developed by the California Department of Transport is used to assess the secondary contribution due to vehicular emissions from the roads within 500 m assessment area.
3.6.20 Under the current EPD guideline, the hourly meteorological data including wind speed, wind direction, and air temperature from the relevant grids from the WRF Meteorological data (same basis for PATH-2016 model), are employed for the model run.
3.6.21
The future prevailing RSP
background concentrations for both assessment scenarios are extracted from the
PATH-2016 model run for Year 2020 without vehicular emission for the
corresponding grids. The traffic
emission within the assessment area in the PATH model has been removed to avoid
the double counting. The FSP
concentration is calculated in accordance with the EPD’s “Guidelines on the
Estimation of PM2.5 for Air Quality Assessment In Hong Kong”. (That
is Annual FSP background = 0.71 * Annual RSP from PATH model and Daily FSP
background = 0.75 * Daily RSP from PATH-2016 model.). The hourly TSP concentration are assumed
to be the same as that for RSP, as the best estimation.
3.7 Assessment Approach and Methodology (Operation Phase Air Quality Impact)
General Approach
3.7.1 Similar to the construction dust impact assessment, in accordance with EPD’s “Guidelines on Assessing the 'TOTAL' Air Quality Impacts”, three components of contribution as follows are considered in evaluating the air quality impact due to the Project upon ASRs.
· Primary contributions: project induced;
· Secondary contributions: pollutant-emitting activities in the immediate neighbourhood. Any emission sources in an area within 500 m radius of the Project area with notable impacts are identified and included in an air quality assessment to cover the short-range contributions using EPD’s approved local-scale Gaussian type model; and
· Background contributions: Year 2020 background concentrations from PATH-2016 (Pollutants in the Atmosphere and their Transport over Hong Kong) model is adopted to estimate future concentrations for Year 2024 and afterwards. Vehicular emissions within the assessment area in the PATH model is removed to avoid double counting.
3.7.2 The following approach has been adopted for the operation phase cumulative air quality impact assessment:
·
Use Gaussian dispersion models i.e.
CALINE4 for line sources and AERMOD for point, area and volume sources to
quantify the air quality impacts from sources including open road emission,
TMWB portal emission, emission from TMWB ventilation building, container
back-up area and industrial emissions in close proximity of the identified
ASRs.
·
The PATH-2016 model results are added to
the sum of the CALINE4 and AERMOD model results sequentially on an hour-to-hour
basis to derive the short-term and long-term cumulative impacts at the
ASRs. The maximum hourly, daily and
annual average results have been then calculated in accordance with the Title
40, Code of Federal Regulations, US Environmental Protection Agency (USEPA 40
CFR) Part 51 “Revision to the Guideline on Air Quality Models, Version
2005”. The pollutant concentration
predicted at an ASR amongst the 8760 hours (a year) have been ranked/ averaged
to assess the cumulative impact.
The number of exceedances for each ASR have been counted and compared
with the acceptance values in the prevailing AQO criteria.
Emission from Open Road Traffic
3.7.3 The principal pollutants associated with traffic emission are NO2, RSP and FSP. Major roads in the proximity of the assessment area include Yuen Long Highway, KSWH, Castle Peak Road, Ping Ha Road and Hung Tin Road. Local access roads, namely Tan Kwan Tsuen Road, Ha Tsuen Road, and Tin Ha Road are also potential sources of air pollution due to the heavy container traffic accessing the nearby ”PBU+SWU”.
3.7.4 The projected 24-hour traffic flows and vehicle compositions which have taken into account the development of concurrent projects including Yuen Long South, Kam Tin South and Tuen Mun Central are adopted in this air quality assessment. Owing to the release of the 2011-based Territorial Population and Employment Data Matrices (TPEDM) population and employment data, a new Technical Note illustrating the methodology to produce the traffic data (include 24-hr traffic flow, trips, daily vehicle-kilometer-travelled (VKT) & speed fraction) has been issued to the Transport Department (TD) for comment. TD has no comment on the Technical Note and the correspondence from TD is attached in Appendix 4.7.1. The traffic data is presented in Appendix 3.3.
3.7.5 EMFAC-HK v3.1.1 model is adopted to estimate the vehicle emission rates of nitrogen oxides and particulate matters, both RSP and FSP. The “vehicle fleet” refers to all motor vehicles operating on roads within this assessment area. The modelled fleet is broken down into 16 vehicle classes based on the information in the Transport Monthly Digest and vehicle population provided by EPD.
3.7.6 The input parameters and model assumptions made in EMFAC-HK model are summarised as follows.
·
Referring to the EPD’s Guideline on
Modelling Vehicle Emissions, “Burden mode” is used for calculating
area-specific emission inventories.
It is selected for this Project, since it can provide hourly vehicular
emissions, taking into account of ambient conditions and speeds combined with
vehicle activity, i.e. the number of vehicles, the kilometers driven per day
and the number of daily trips.
·
Each vehicle class has diverse
technological factors in different years.
According to the underlying assumption in the EMFAC-HK model, each
vehicle class can be modelled by the individual behaviour of the unique
technology groups. Each technology
group represents the vehicles from the same class but has distinct emission
control technologies, has similar in-use deterioration rates and respond the
same to repair. It means that the
vehicles from the same class have the same emission standards or specific
equipment installed in them (e.g. multi-port fuel injection, three-way
catalyst, adaptive fuel controls, etc.) which make them have the same
performance.
·
The “2013 Licensed Vehicle by Age and
Technology Group Fractions” provided in EPD’s website, is adopted in this
assessment. Since the provided
exhaust technology fractions are only up to Year 2013 at the time of the
assessment, those after Year 2013 are projected in accordance with EPD’s
Guideline on Modelling Vehicle Emissions – Appendix 3 “Implementation Schedule
of Vehicle Emission Standards in Hong Kong (Updated as at 29 December 2015)”
and Appendix 4 “EMFAC-HK Technology Group Indexes (Released in January 2016)”.
·
According to EPD’s Guideline on Modelling
Vehicle Emissions - Appendix 2, the implementation schedules of Euro V and Euro
VI standards are in the middle of a year for some vehicle classes or fuel
types. Since the detailed fraction
data is not available after Year 2010, as a conservative approach, the exhaust
technology fractions of these vehicle classes or fuel types are assumed to be
kept as the previous standards fully for the scheduled year, while upgraded to
the higher standards fully at the following year. Evaporative technology fraction in the
model is based on the default value.
·
As recommended in the EPD’s Guideline on
Modelling Vehicle Emissions, default vehicle populations forecast in EMFAC-HK
is used.
·
Vehicle-kilometer-travelled (VKT)
represents the total distance travelled on a weekday. The VKT is calculated by multiplying the
number of vehicles, which based on the highest predicted hourly traffic flow,
and the length of road travelled in the assessment area. The diurnal variation of VKT in the assessment
area is provided by the traffic consultant, and the input in the model is by
vehicle/fuel/hour.
·
The default accrual rates in EMFAC-HK are
estimated from the local mileage data adjusted to reflect the total VKT for
each vehicle class. The default value
has been used.
·
For those roads with cold starts as
advised by the traffic consultant, the diurnal variation of daily trips in the
assessment area of the Project applied in the EMFAC-HK model is provided by the
traffic consultant.
·
Speed fraction represents the percentage
in different speed ranges of each vehicle type weighted by VKT. The speed limits of existing road were
made reference to the Traffic AIDs (plan marked the road marking, traffic sign
and speed limits) from TD, while the speed limits of the proposed road are
provided by traffic consultant.
·
In accordance with the Road Traffic
Ordinance, for any road with design speed limit of 70 kph or above, the speed
limit for medium goods vehicles, heavy goods vehicles, buses and buses would be
limited to not more than 70 kph.
Thus, the speeds of medium goods vehicles, heavy goods vehicles and
buses from the flow speed or 70 kph, whichever is lower, are adopted. For the public light buses, the speed
limit should be limited to post speed of the carriageway or 80 kph, whichever
is lower, are adopted.
3.7.7 According to “Guidelines on Choice of Models and Model Parameters”, NO2/NOx ratios of each vehicle type varies from type to type. NO2/NOx ratio of each vehicle is extracted from the EMFAC-HK. With these extracted ratios, the emission rate of NOx estimated by EMFAC-HK can be further divided into emission rates of NO and NO2. The NO2/NOx ratios are presented in Appendix 3.4.
3.7.8 The hourly emissions of NO, NO2, RSP and FSP are divided by the number of vehicles and the distance travelled to obtain the emission factors in gram per miles per vehicle. The calculated 24-hour emission factors of 16 vehicle classes for each road type are adopted in this air quality impact assessment. The detailed calculation of vehicular emission source is presented in Appendix 3.4.
3.7.9 The United States Environmental Protection Agency (USEPA) approved CALINE4 dispersion model has been used to assess traffic emissions impact from existing and planned road network. Owing to various phases of development of the Project, surface roughness coefficient of each modelling grid adopted in the CALINE4 model varies with time, ranging from 100 cm to 370 cm for mid-rise and high-rise development areas respectively. The surface roughness coefficient of each grid in each assessment year is summarised in Table 3.13. The grid-specific WRF meteorological data have also been adopted to calculate the hourly impact. PCRAMMET has been applied to generate Pasquill-Gifford stability class for the meteorological input to CALINE4 model based on the WRF meteorological data.
Table 3.13 Surface Roughness adopted in CALINE4 of Modelling Grid
|
Grid |
Year 2024 – Year 2030 |
Year 2031 – Year 2039 |
|
|
Construction Phase |
Operation Phase |
||
|
20, 47 |
370 cm |
370 cm |
370 cm |
|
20, 48 |
370 cm |
370 cm |
370 cm |
|
20, 49 |
100 cm |
100 cm |
100 cm |
|
21, 44 |
100 cm |
100 cm |
100 cm |
|
21, 45 |
100 cm |
370 cm |
370 cm |
|
21, 46 |
100 cm |
370 cm |
370 cm |
|
21, 47 |
100 cm |
100 cm |
370 cm |
|
21, 48 |
370 cm |
370 cm |
370 cm |
|
21, 49 |
100 cm |
370 cm |
370 cm |
|
21, 50 |
100 cm |
100 cm |
100 cm |
|
22, 44 |
100 cm |
100 cm |
100 cm |
|
22, 45 |
100 cm |
370 cm |
370 cm |
|
22, 46 |
370 cm |
370 cm |
370 cm |
|
22, 47 |
100 cm |
100 cm |
370 cm |
|
22, 48 |
100 cm |
100 cm |
370 cm |
|
22, 49 |
370 cm |
370 cm |
370 cm |
|
23, 46 |
100 cm |
100 cm |
100 cm |
|
23, 47 |
370 cm |
370 cm |
370 cm |
|
23, 48 |
370 cm |
370 cm |
370 cm |
3.7.10 Owing to the height difference between at-grade roads and bridges, road emission has been grouped into two scenarios; namely “Bridge” and “At-grade”. The “Bridge” scenario features the KSWH as a bridge of 20 meters above ground. The height of the Highway ranges from 35 mPD to 40 mPD with ground surface at 15 mPD – 20 mPD. As a conservative consideration, the height is considered as 20 m above ground only. The discrepancy of receptor heights between “Bridge” scenario and other two source scenarios are due to the relative frame of Bridge scenario to the other two. Owing to the limitation of Caline4 model, the highway is set to 10 meters above ground in the model and the frame of modeling domain has a relative height of 10 meters above the actual ground. Receptors with actual heights equal or lower than 10 mAG are assumed to have the same prediction as lowest height in the model. In order to map the receptors correctly with other two source scenarios, the correction of receptor heights has been done in the input file before the summation calculation of cumulative results. Receptors with actual heights equal or lower than 10 mAG are set to the lowest assessment level in the modeling frame, i.e. 1.5 m. Also, receptors with actual heights higher than 10 mAG are decreased by 10 m. Table 3.14 illustrates the mapping of the receptor results in the calculation.
Table 3.14 “Adjusted” Modelling Height in Caline4 Results
|
Actual receivers height above Local
Ground |
Modelling height for the bridge (10
mAG as the reference zero) |
Modelling height for at-grade roads
(0 mAG as the reference zero) |
Cumulative results on all roads
(bridge + at-grade contributions) |
|
1.5
m |
1.5
m (below reference zero modeled
as the lowest height) |
1.5
m |
1.5
m + 1.5 m |
|
5 m |
1.5
m (below reference zero modeled
as the lowest height) |
5 m |
1.5
m + 5 m |
|
10
m |
1.5
m (below reference zero modeled
as the lowest height) |
10
m |
1.5
m + 10 m |
|
20
m |
10
m |
20
m |
10
m + 20 m |
3.7.11 For the calculation of NO2 concentrations, the predicted NO is converted to NO2 based on the Ozone Limiting Method with the background ozone concentration in accordance with the EPD’s Guidelines on Choice of Models and Model Parameters. The predicted NO2 is directly adopted for the determination of Total NO2 concentration.
3.7.12 Secondary air quality impact arising from the implementation of roadside noise barriers has been incorporated into the air quality model. Extent of the proposed noise mitigation measures are presented in the Noise Section (Section 4) and are summarised in Table 4.28.
Emission from Portal and Ventilation Building of TMWB
3.7.13 The portal and the ventilation building of the northern section of TMWB are assumed to be located at the west of the Project. The design information of TMWB is not available at the time of the assessment. In reference to approved EIA Report for Tuen Mun - Chek Lap Kok Link, it is assumed that the emission split would be 10% from the northbound tube of the portal and 90% from the ventilation building. The traffic flow of road links relevant to the tunnel is adopted to estimate the portal emission, together with the composite emission rates derived from the EMFAC-HK results. The detailed calculation of portal emission rates is presented in Appendix 3.5.
3.7.14 Portal emissions from TMWB are modelled based on the procedures in Section III of the Permanent International Association of Road Congress Report (PIARC), 1991. It is assumed that emissions would emerge as an air jet along the axis of the road so that only the well-diluted parts gradually shear off. The pollutants are assumed to be ejected as a volume source in the model, with two-thirds of the total emissions dispersed in the first 50 m, and one third of the total emissions dispersed in the second 50 m. The portal emissions are modelled as volume sources in American Meteorological Society (AMS) and U.S. Environmental Protection Agency (EPA) Regulatory Model (AERMOD).
Emission from Industrial Source
3.7.15 Based on the best available information obtained under “Agreement No. CE 66/96, Planning and Development Study on North West New Territories”, there are some discrete chimneys located within and in vicinity of the Project area. Chimney validation surveys have been conducted in June and July 2012 to update the operation status of chimneys. A further validation check was conducted in early and end 2015. In total, 21 nos. of chimney existing within 500m assessment area are found active and considered in the air quality assessment. The details of these chimneys (labelling as CH) including emission inventory and its chimney parameters, and its locations are presented in Appendix 3.2.
3.7.16
A review has also been
conducted for the SP licences within the assessment area, and the concerned
plants are listed in Table 3.15.
In total, there are seven concrete batching plants, one asphalt plant
and one stone crushing plant found within 500 m assessment area. The concrete batching plant, asphalt
plant and the stone crushing plant at Lam Tei Quarry would be terminated before
Year 2024. There are four concrete
batching plants would be affected by the Project development and are required
to be removed. Therefore, the impacts
from these five concrete batching plants, a stone crushing plant and an asphalt
plant would not be considered in the assessment. The remaining two existing concrete
batching plants in the vicinity of the Project area are assumed to be still in
operation in future and considered in the assessment. Referring to the Revised RODP, the
planned industrial zone, Site 3-47 in the Project area is assumed for
locating three new
concrete batching plants. For the purpose of the air quality impact assessment in the EIA Study, the capacity of each new
concrete batching plant at Site 3-47 is assumed to have the highest
production capacity among the four existing concrete batching plants. For these concrete batching plants to be operated in
future, the particulates concentration limit follow the Guidance Notes on Best
Practicable Means (BPM) for Specified Process – Cement Plant (Concrete Batching
Plant), BPM 32/16, issued in February 2016. The detailed emission rate calculation
for concrete batching plant is presented in Appendix 3.2.
Table 3.15 Existing SP Activities within the Assessment Area
|
Model
ID |
Company
Name |
Industry |
Location |
SP
Licence No. |
Remark |
|
- |
Glorious
Concrete (H.K.) Limited |
Concrete
Batching |
Lot 1824, DD
130 Yick Yuen |
L-3-043(4) |
To be affected
by the Project development and
would be removed |
|
CBPa_1 –
CBPa_16, CBPb_1 – CPBb_16, CBPc_1 – CBPc_16 |
Multi-Way
Industrial Limited |
Concrete
Batching |
Lot 1825, DD
130, Tuen Mun |
L-3-128(4) |
To be affected
by the Project development and
would be removed Highest production capacity among the affected CBPs and the capacity is taken as that of the new CBP in the industrial area. |
|
- |
Anderson
Concrete Limited |
Concrete
Batching |
Lot 362, DD
127, Kiu Tau Wai, Yuen Long |
L-3-057(6) |
To be affected
by the Project development and
would be removed |
|
- |
Heng Tat
Concrete Limited |
Concrete Batching |
DD 124, Lot
793 & DD 127 Lot 70-77, 215RP & 216 Hung Uk Tsuen, Yuen Long |
L-3-230(1) |
To be affected
by the Project development and
would be removed |
|
GO1 – GO11 |
Golik Concrete Limited |
Concrete
Batching |
Lot No. 1842
in DD121, 89 Tong Yan San Tsuen, Yuen Long, N.T. |
L-3-229(2) |
Existing CBP
in the vicinity of the Project area.
For the purpose of assessment in this EIA study, it assumes that the
plant still be in operation in future |
|
RED1, RED3 -
RED24 |
Redland
Concrete Limited |
Concrete
Batching |
Lots Nos.
1207RP, 1208A, 1263RP(part), 1265RP, 1842RP & Adjoining G.L. in DD121,
Tong Yan San Tsuen Road, Tong Yan San Tsuen, Yuen Long, N.T. |
L-3-199(4) |
Existing CBP
in the vicinity of the Project For the
purpose of assessment in this EIA study, it assumes that the plant still be in operation
in future |
|
- |
Faith Oriental
Investment Limited |
Stone Crushing |
Lam Tei Quarry |
L-11-52(1) |
Terminate
before 2024 |
|
- |
|
Concrete
Batching 1 |
Lam Tei Quarry |
- |
Terminate
before 2024 |
|
- |
|
Asphalt 1 |
Lam Tei Quarry |
- |
Terminate
before 2024 |
Note: [1]
The SP Licences for concrete batching plant and asphalt plant at Lam Tei Quarry
are under review.
3.7.17
Emissions (NOx, SO2,
RSP and FSP) from chimneys identified within the assessment area have been
modelled as point sources while emissions (TSP, RSP and FSP) from the above
mentioned SPs are modelled as point sources and area sources. The emission rates of the chimneys are
presented in Appendix
3.2. For the chimneys newly
identified during the site survey, an average fuel usage of 200 Liters/hour is
assumed for the calculation of emissions, while the heights of the chimneys are
based on observation. Use of
distillate oil is assumed for the chimneys. Based on the size of the boiler, the
corresponding emission factors with reference to Tables 1.3-1 and 1.3-7 of
AP-42, USEPA have been adopted in the calculation. Sulphur diesel content of 0.005% is
adopted for the chimneys, in accordance with the requirement under the APCO
(Fuel Restriction) (Amendment) Regulation 2008.
3.7.18 The methodology as recommended in the EPDs’ Guidelines on “Estimating Height Restriction and Position of Fresh Air Intake Using Gaussian Plume Models” have been adopted. For those stacks with no available data on stack parameter, emission temperature of 373K, exit velocity of 6 m/s and stack diameter of 1 m are assumed. For those concrete batching plants (CBPs), their emission is assumed to release at ambient temperature.
3.7.19 The use of fuel for the future stack emission sources within the areas zoned “Government” is still undetermined at this stage. Since any installation of chimneys for commercial/hospitals/medical centre would require separate approval/application from EPD in order to make sure that there is no adverse impact to the adjoining environment, for the purpose of this assessment, distillate oil and town gas are assumed to be used as power source for steam boilers and emergency generator. With such application, it is understood that the total chimney emission from a hospital should be proportional to the total number of patient accommodated in the hospital (i.e. number of bed). According to the North East New Territories (NENT) EIA report, it was assumed that there would be a total of 860 beds available in the proposed hospital in NENT, while the number of beds in the proposed hospital is estimated to be about 1000 with reference to the design assumption of the Revised RODP. Therefore, in order to estimate the emission from the proposed hospital, a correction factor of 1.16 has been multiplied to the chimney emission from NENT proposed hospital. The emission rate calculation for the chimney of planned hospital (labelling as “HP”) is presented in Appendix 3.2.
Emission from Port Backup and Logistic Facilities
3.7.20
For the purpose of this
assessment, the number of off-road vehicles and plants has been roughly assumed
based on the similar operation of Container Terminal 1 – 9 in the Tsing Yi
area. Since the actual layout and
the configuration of these facilities have not been formulated, it is assumed
that the emissions (NOx & RSP) from off-road vehicles and plants at open
area would be area source at ground
level at Revised RODP stage. The
emission rates from off-road equipment and back-up facilities have been
estimated with reference to the US Tier 3 Emission Standard (130≤kW<225)
following the Air Pollution Control (Non-road Mobile Machinery) (Emission)
Regulation. The post speed of these
off-road vehicles within the Port Backup and Logistic Facilities is assumed as
10KPH in the assessment. Idling
emission is based on "Road Tunnels: Vehicle Emissions and Air Demand for
Ventilation" published by Permanent International Association of Road Congress (PIARC, 2012). Emission standard of Euro V is assumed
for non-road vehicles according to the requirements as stipulated under the Air Pollution Control (Vehicle Design Standards)
(Emission) Regulations (Cap. 311J).
The 3-minutes idling of motor vehicles as stipulated in Motor Vehicle
Idling (Fixed Penalty) Ordinance is considered for general case. The details of port backup sources (labelling
with prefix P) such as emission rates in detail are
presented in Appendix
3.2.
Dispersion Modelling & Concentration Calculation
3.7.21 American Meteorological Society (AMS) and U.S. Environmental Protection Agency (EPA) Regulatory Model (AERMOD), the EPD approved air dispersion model, has been employed to predict the air quality impacts due to industrial emission, portal emission from TMWB and emission from Port Backup/Logistic Facilities. The air pollutants concentrations are predicted at each identified ASRs at various assessment height, ranging from 1.5 mAG up to the roof level of the respective ASRs.
3.7.22 Hourly meteorological conditions including wind data, temperature, relative humidity, pressure cloud cover and mixing height of Year 2010 are extracted from the WRF meteorological data adopted in the PATH-2016 system. The minimum wind speed is capped at 1 metre per second. The height of the input data is assumed to be 9 and 26 meters above ground for the first and second layers of the WRF data as input respectively.
3.7.23 Surface characteristic parameters such as albedo, Bowen ratio and surface roughness are required in the AERMET (the meteorological pre-processor of AERMOD). The land use characteristics of the surrounding are classified into sectors. The parameters of each sector are then suggested by AERMET by default according to its land use characteristics. The detailed assumptions are discussed in Appendix 3.17.
3.7.24 The spot heights and contour heights on the basemap are extracted to be used as the terrain input data of the AERMOD’s terrain pre-processor, AERMAP.
3.7.25 Gradual plume rise option has been employed for all modelled pollutants. Dry deposition and depletion have been employed for particulate matter. Particle size distribution adopted for chimney, CBP and off-road vehicle and plant are summarised in Table 3.16, Table 3.17 and Table 3.18. Since the size distribution (less than 10 µm but larger than 2.5 µm) are known for various sources, Method 1 of particle dry deposition has been adopted for modelling using AERMOD.
Table 3.16 Particle Size Distribution of Chimney
|
Particle Size, µm |
Average Particle Size (µm) |
Percentage % |
|
0.625 |
0.31 |
58.3 |
|
1 |
0.81 |
3.3 |
|
1.25 |
1.13 |
1.7 |
|
2.5 |
1.88 |
6.7 |
|
6 |
4.25 |
11.7 |
|
10 |
8.00 |
10.0 |
|
15 |
12.50 |
8.3 |
|
30 |
22.50 |
40.0 |
Reference: Table 1.3-5, Section 1.3, AP-42.
Table 3.17 Particle Size Distribution of Concrete Batching Plant
|
Particle Size, µm |
Average Particle Size (µm) |
Percentage % |
|
General Activity(i) |
||
|
1.0 |
0.50 |
4.0 |
|
2.0 |
1.50 |
7.0 |
|
2.5 |
2.25 |
4.0 |
|
3.0 |
2.75 |
3.0 |
|
4.0 |
3.50 |
7.0 |
|
5.0 |
4.50 |
5.0 |
|
6.0 |
5.50 |
4.0 |
|
10.0 |
8.00 |
17.0 |
|
30.0 |
20.00 |
49.0 |
|
Haul Road(ii) |
||
|
2.5 |
1.25 |
4.6 |
|
10 |
6.25 |
14.6 |
|
15 |
12.5 |
4.6 |
|
30 |
22.5 |
76.2 |
Reference:
i)
Reference:
Table B.2.2 - Category: 3, Appendix B2, AP42.
ii)
Table
13.2.1-1,Section 13.2.1, AP42.
Table 3.18 Particle Size Distribution for Off-Road Vehicles and Plants
|
Particle Size, µm |
Average
Particle Size (µm) |
Percentage
% |
|
1.0 |
0.50 |
82.0 |
|
2.0 |
1.50 |
6.0 |
|
2.5 |
2.25 |
2.0 |
|
3.0 |
2.75 |
0.0 |
|
4.0 |
3.50 |
2.0 |
|
5.0 |
4.50 |
1.0 |
|
6.0 |
5.5 |
0.0 |
|
10.0 |
8 |
3.0 |
|
30.0 |
20 |
4.0 |
Reference: Table B.2.2 - Category: 1, Appendix B2,
AP-42.
3.7.26 For the calculation of NO2 concentrations from Port Backup/Logistic Facilities plus Industrial Sources, the conversion from NOx to NO2 is based on the Ozone Limiting Method and the background ozone concentration, assuming the NO2 to be 28% of NOx for Port Backup/Logistic source while 10% for Industrial Sources.
3.7.27 Conversion factor for 10-minute average of SO2 concentration refers to Guidelines on Estimation of 10-minute Average SO2 Concentration for Air Quality Assessment in Hong Kong, HKEPD. The P-G stability classes and corresponding conversion factors are summarised in Table 3.19.
Table 3.19 Conversion Factor for 10-min Average SO2 Concentration
|
P-G Stability Class |
Conversion Factor |
|
A |
2.45 |
|
B |
2.45 |
|
C |
1.82 |
|
D |
1.43 |
|
E |
1.35 |
|
F |
1.35 |
Determination of Assessment Year
3.7.28 Referring to the construction programme as presented in Appendix 2.4, the first population intake of the planned residential development under this Project would be Site 5-26 in Year 2024. During Year 2025 – 2030, there are some port back-up and logistic facilities sites to be occupied. More planned sites to be available for intake since Year 2031 and the development sites are expected to be completed and are occupied by Year 2036 - 2039. For determination of the worst case year for the assessment, emission burden of open roads for Year 2024 (first year intake of proposed Project), Year 2026 to 2028, Year 2031 (first major population intake year), Year 2036 to 2039 (15 years after commissioning of proposed Project) are calculated by EMFAC-HK model and the results are presented in Table 3.20. The detailed calculation is attached in Appendix 3.4. Results indicate that the maximum emission burden among the 15 years is Year 2026. Despite the vehicular emission factors in Year 2024 are higher than that in Year 2026, Year 2026 traffic flow has taken into account the major development of concurrent projects including Yuen Long South, Kam Tin South and Tuen Mun Central. The emission burden in Year 2026 is therefore higher than Year 2024. The assessment scenario in Year 2026 can cover the impact in Year 2024, model run for Year 2024 is considered unnecessary.
Table 3.20 Emission Burden of Open Roads for Various Years
|
Year |
NOX (tonnes per annum) |
RSP (tonnes per annum) |
FSP (tonnes per annum) |
|
Year 2024 |
298.9 |
12.2 |
11.2 |
|
Year 2026 |
307.8 |
12.6 |
11.6 |
|
Year 2027 |
300.2 |
12.4 |
11.4 |
|
Year 2028 |
291.5 |
12.1 |
11.1 |
|
Year 2031 |
189.7 |
7.1 |
6.6 |
|
Year 2036 |
186.6 |
4.9 |
4.6 |
|
Year 2037 |
186.4 |
5.0 |
4.6 |
|
Year 2038 |
186.9 |
5.1 |
4.7 |
|
Year 2039 |
188.0 |
5.4 |
5.0 |
3.7.29 Based on the population intake years, the following two assessment scenarios are studied for the evaluation of the operational air quality impact. The cumulative emission sources considered in these two scenarios are listed in Table 3.21 and Table 3.22, respectively. As mentioned in Section 3.5.1, the construction programme for TMWB is not available at the time of the assessment, its construction dust impact would not be considered in the assessment, however, its operation phase vehicular emission impact would be considered in the assessment since Year 2031.
Table 3.21 Operation Phase Scenario Justification
|
Scenario |
Justification |
ASRs Considered in the Assessment |
|
Scenario 1: Year 2024 – Year 2030 |
First population intake in Project area is Year 2024. Referring to the emission burden calculation as shown in Table 3.20, Year 2026 is considered
the worst emission burden year between Year 2024 and Year 2030. Thus traffic
flow and emission factor of Year 2026 are used. |
All representative existing ASRs and planned ASRs
occupied during Year 2024 - 2030. The locations of the ASRs considered in the model
are shown in Figure 3.2.1-3.2.6.
|
|
Scenario 2: Year 2031 – Year 2039 |
First major population intake in Project area is Year 2031. Among Year 2031 – 2039, Year 2031 is the highest emission burden rate
but it cover parts of new roads within the Project area only. In Year 2036, all new roads within the
Project area including all DP roads would be open, therefore, the NOx emission burden is calculated based on Year 2036
traffic flow and Year 2031 emission factor. The calculated NOx, RSP and FSP
emission burden would be 233.2, 8.728 and 8.114 tonnes per annum
respectively, higher than the emission burden in any year from Year 2031 to
2039 as shown in Table 3.20. |
All representative existing ASRs and planned ASRs
within 500m assessment area of the Project are considered in the assessment. The locations of the ASRs considered in the model
refer to Figure 3.3.1-3.3.6. |
Table 3.22 Cumulative Emission Sources in Scenario 1: Year
2024-2030 (Operation Phase)
|
Source |
Remarks |
|
Open Road Traffic |
·
With a section of Road P1 (DP1), a section of Road D1(DP2) and
junction of D8/P1 (DP5) connecting ”PBU+SWU”, and all existing roads
within 500 m assessment area ·
Traffic
data: Year 2026 ·
Emission
Factor: Year 2026 |
|
Industrial source |
·
Existing
Chimneys and SPs ·
3 new CBPs and 2 relocated chimneys ·
”PBU+SWU”
at Site 3-6, 3-7 & 3-8 |
Table 3.23 Cumulative Emission Sources in Scenario 2: Year 2031-2039 (Operation Phase)
|
Source |
Remarks |
|
Open Road Traffic |
·
All
existing roads within 500 m assessment area and planned roads including all
DP roads within the Project area ·
Traffic data:
Year 2036 (which has considered the traffic flow of all DPs roads) ·
Emission
Factor: Year 2031 |
|
Industrial source |
·
Existing
Chimneys and SPs ·
3 new CBPs and 2 relocated chimneys ·
”PBU+SWU”
at Site 3-1 to 3-14 |
|
Portal Emission and Ventilation Building |
TMWB |
|
Boiler at planned hospital (commencement in Year
2036) |
Pro-rata emission with designed capacity (1000
beds) with reference to the one of NENT EIA. |
3.7.30 It is anticipated that NO2, RSP and FSP are the key pollutants to be considered for vehicular emission and chimneys emission, and SO2 for chimneys emission only during operation phase.
3.8 Assessment Approach and Methodology (Operational Phase Odour Impact)
Odour Emission Inventory of the Existing Chicken Farm
3.8.1 Site visits were made in end 2014 and July 2015, and a brief interview and site walk have been made with the owner of the chicken farm. Each chicken house could house about 5,000 – 10,000 numbers of chicken depending on its size. As a common practice in the trade that once the chicken are sold, the whole chicken house would then be cleansed and sterilised, and leave it vacant for about 10 days in order to prevent infection of disease.
3.8.2 Natural ventilation with the aid of fans is generally adopted in chicken houses to ensure the fresh air supply. As a common practice, medium and large chickens would be caged in the form of “A-shaped” on top of a purposely built channel to collect the excrements from chickens. In general, accumulated excrements along the channels will gather from the end of channel to the temporary storage tank manually once per day (at around 2:00pm). The excrements will then transfer into enclosed rubbish bins, which will be collected by licensed waste collector few times a week.
3.8.3 In terms of small chickens, they are kept separately from other mature chickens to avoid cross-infection. Excrements would be retained on papers underneath for ultimate disposal into rubbish bins.
3.8.4 There are also on-site covered septic tanks for treatment of domestic effluent. Based on the site observation, there is no “noticeable smell” identified. During the cleansing/maintenance period, a very short-term transient smell might be detected.
3.8.5 The number of chickens kept within the chicken farm would be varied, and such variation is very much affected by demand and supply from the market. In general, several high-demand periods would occur right before Chinese Festivals, such as Lunar New Year, Dragon Boat Festival, Mid-Autumn Festival and Winter Solstice. A maximum of about 102,000 chickens can be kept under the licence.
3.8.6 Based on the current information from EPD, there is no complaint on odour received from the existing/adjoining villages in the past 10 years. With the proper operation conditions/ maintenance procedures required under AFCD licence, adverse odour impact is not expected in the past.
3.8.7 The layout of the existing chicken farm and the photo records during the site visit in July 2015 are attached in Appendix 3.6. Based on the observation during the site visit, potential odour emission sources within the chicken farm are identified as below.
·
Chicken Houses for small, medium or large
sized chicken; and
·
Garbage Collection Area.
3.8.8 For establishment of the odour emission inventory for odour impact assessment, odour sampling was conducted at the potential odour emission sources within the chicken farm on 18, 19 and 24 August 2015 of a three non-rainy days with daytime’s temperature greater than 30°C (during sampling period) at site. Odour patrol/spot-check survey was also conducted at these three days at different time slots to understand the actual odour condition at the existing ASRs in the vicinity of the chicken farm. Specifically, the operation status of all the odour emitting sources within the chicken farm should also be determined to check whether or not the odour emitting process is underway during the odour patrol. As such, the odour patrol/spot-check was conducted at the same time frame as the in-situ odour sampling within the chicken farm as far as possible (“in order to synchronise the data at the same time/day”).
3.8.9 The details of the odour sampling and olfactometric analysis, and odour patrol/spot-check survey are presented in Appendix 3.7.
3.8.10 A specific odour emission rate (SOER) of each sample taken in chicken house, garage collection area and septic tank is determined in the odour survey. With reference to the SOER determined by the odour sampling, the odour emission rate of each chicken house is determined according to the total area of the excretion collection channels inside each chicken house or the size of the exposed area. The details for deriving the odour emission rates from the measurement results are presented in Appendix 3.6. The derived odour emission rate of each structure in the chicken farm is summarised in below Table 3.24.
Table 3.24 Effective Odour Emission Rate of Odour Source in Chicken Farm
|
ID |
Description |
SOER (OU/m2·s) |
Total
Exposed Area (m2) |
Odour
Emission Rate by Measurement (OU/s) |
|
A [1] |
Large-sized Chicken House |
211.2 [3] |
45 |
9504.0 |
|
B |
Medium-sized Chicken House |
2.19 |
640 |
1401.6 |
|
C |
Medium-sized Chicken House |
2.19 |
200 |
438.0 |
|
D |
Medium-sized Chicken House |
2.19 |
120 |
262.8 |
|
E [1] |
Small-sized Chicken House (Active Vent) |
48.4 [4] |
4.00 |
193.6 |
|
F |
Small-sized Chicken House |
0.39 |
60 |
23.4 |
|
G |
Small-to-Medium Chicken House |
0.43 |
120 |
52.0 |
|
H |
Small-sized Chicken House |
0.39 |
130 |
50.6 |
|
I |
Small-sized Chicken House |
0.39 |
35 |
13.6 |
|
J [2] |
Garbage Collection Area |
0.48 |
N/A |
N/A |
|
K [2] |
Septic Tank |
4.55 |
N/A |
N/A |
Remark:
[1] The ventilation fans were turned on during
sampling, thus the emission rate is determined by the concentration measured
downstream of the ventilation fan.
[2] Direct adoption of SOER determined by odour
sampling for area sources.
[3] Determined by odour concentration of 64 OU/m3
and flow rate of 3.3 m/s, details refer to Appendix 3.6.
[4] Determined by odour concentration of 22 OU/m3
and flow rate of 2.2 m/s, details refer to Appendix 3.6.
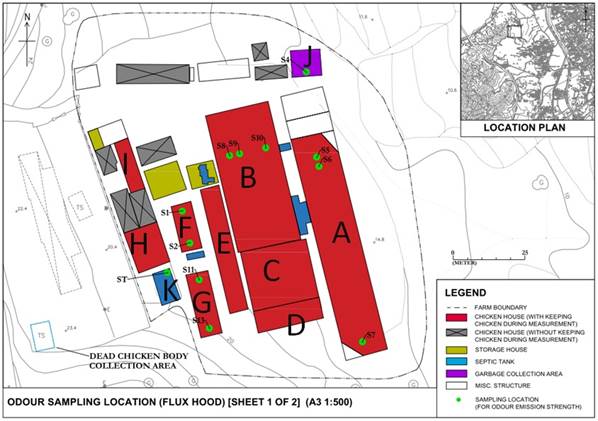
3.8.11 The odour emission rate in each hour would not achieve as high as the figures estimated above in Table 3.24 because the excretion collection channels are cleaned regularly at around 2:00pm everyday as described in Section 3.8.2. However, as a conservative assessment approach, the odour emission rate is considered as same in every hour in the assessment.
Odour Emission Inventory for Upgraded San Wai STW, New HSK STW and Planned Refuse Transfer Station
3.8.12 The upgraded San Wai STW, new HSK STW and planned Refuse Transfer Station (RTS) would be located within 500 m area, therefore, cumulative odour impact from these three facilities are assessed.
Upgraded San Wai STW
3.8.13 An EIA Study for “Upgrading and Expansion of San Wai STW and the Expansion of Ha Tsuen PS” has been conducted in Year 2002 and was approved in Year 2003. The study has proposed that all potential odour emission sources of the STW would be enclosed and the vented air would be treated in the deodourising unit with 96% of H2S removal efficiency. As there is no further change in the design of this STW, the mitigated odour emission rate as presented in the EIA Report is adopted in this assessment. The emission rate of the upgraded San Wai STW is presented in Appendix 3.8.
New HSK STW
3.8.14 The design capacity of the new Sewage Treatment Works (STW) would be 85,500 m3 per day and the sewage will be treated by tertiary treatment and secondary plus treatment (with UV disinfection and 75% nitrogen removal). A separate EIA study would be conducted for this new STW in future. For the purpose of the assessment in this EIA Study, the design of STW is made reference to the design of Shek Wu Hui STW as (i) it is Tertiary Sewage Treatment Plant and (ii) the influent of both STWs are municipal sewage.
3.8.15 The NENT EIA study has conducted odour impact assessment on the Shek Wu Hui STW based on the ultimate capacity of 190,000 m3 per day and the odour source emission areas of the STW would be enclosed and the vented air would be treated in the deodorising unit. The design of the planned STW would make reference to the treatment design of the Shek Wu Hui STW in the NENT EIA Report. The capacity of Shek Wu Hui is about two times of that of the new HSK STW, it is assumed that the emission source area of the new HSK STW would be about half of that of Shek Wu Hui STW. As the odour emission rates depends on the exposed area of the sewage treatment facilities such as inlet channel, primary sedimentation tanks, final sedimentation tanks, the odour emission rates of new HSK STW would be assumed as half of total odour emission rates of all enclosed odour emission sources areas of Shek Wu Hui STW. The details of the emission rate and deodourising unit of the new HSK STW are presented in Appendix 3.8.
Planned Refuse Transfer Station
3.8.16 The design capacity of the planned RTS would be 1,100 tonnes per day and the design would be similar to the existing RTS in Hong Kong. A separate EIA study for this planned new RTS would be conducted in future. For the purpose of the assessment in this EIA Study, the design of STW (i.e. number of stacks, height and diameter of stacks, etc.) is made reference to similar capacity of existing RTS, North Lantau Transfer Station which is 1,200 tonnes per day of the design capacity.
3.8.17 There is no available odour emission data for existing RTS in Hong Kong. Therefore, the odour emission rate of planned RTS considered in the assessment adopts the average measured SOER at tipping face (for municipal solid waste) of NENT Landfill extracted from the approved NENT Landfill EXT EIA Report. The details of the emission rate and the design assumption for new RTS are presented in Appendix 3.8.
Modelling Approach and Parameter
3.8.18 The existing chicken farm is located at northwest of the Project area (about 200 m from south-west of Fung Kong Tsuen) while San Wai STW, new HSK STW and planned RTS are located at the west of the Project area (next to KSWH and Ha Tsuen Road). The separation distance between existing chicken farm and the STWs/RTS is at least 850 m. There is no common ASR from these two groups of odour sources (chicken farm and the STWs/RTS), therefore, no cumulative odour impact would be anticipated. The evaluation of the odour impact from these two groups of odour sources is conducted separately using AERMOD model. The hourly meteorological data including wind data, temperature, relative humidity, pressure, cloud cover and mixing height of Year 2010 are extracted from the WRF meteorological data adopted in the PATH-2016 system. The minimum wind speed is capped at 1 metre per second. The height of the anemometer is assumed to be 9 meters above ground for the first layer of the WRF data as input.
3.8.19 Surface characteristic parameters such as albedo, Bowen ratio and surface roughness are required in the AERMET (the meteorological pre-processor of AERMOD). The land use characteristics of the surrounding are classified into sectors. The parameters of each sector are then suggested by AERMET by default according to its land use characteristics. The detailed assumptions are discussed in Appendix 3.17.
3.8.20 More recent research indicated that the peak-to-mean ratio of odour dispersion would depend upon the type of source, atmospheric stability and distance downwind. For the purpose of this assessment to produce more reasonable predictions for odour dispersion from wake-affected point sources and area/volume sources, reference is made to the peak-to-mean ratio stipulated in “Approved Methods for Modelling and Assessment of Air Pollutants in New South Wales” published by the Department of Environment and Conservation, New South Wales, Australia (NSW Approved Method).
3.8.21 The dispersion modelling techniques employed for this assessment follows those described in EPD’s “Guidelines on Choice of Models and Model Parameters” except the use of alternative peak-to-mean ratios for wake-affected point sources and volume sources. However, it should be noted that the peak-to-mean ratios stated in the NSW Approved Method are derived based on experimental and theoretical analyses and assuming a 0.1% exceedance level (Ref.: Statistical Elements of Predicting the Impact of a Variety of Odour Sources, Peter R. Best, Karen E. Lunney and Christine A. Killip, Water Science and Technology, Australia, 44: 9 pp 157-164 2001). In other words, there would be a 0.1% probability that the actual peak concentration would be higher than those derived with the peak-to-mean ratios stated in the NSW Approved Method.
3.8.22 The chimneys of the deodourising units of expanded and upgraded San Wai STW, new HSK STW and planned RTS are considered wake-affected point sources while the emission sources of the chicken farm are assumed to be volume sources for input into model. Table 3.25 shows the conversion factors to be used for converting the maximum modelled 1-hour average concentrations to corresponding maximum 1-second average concentrations that could occur during that hour.
3.8.23 Regarding the odour emission sources of chicken farm, the size of each volume source is determined by the averaged wind flux (m/s) within each chicken house multiplied by the cross-sectional area of openings (or house). With the general mixing by internal fans or natural wind, the dilution/diffusion factor between the excrement channel concentration and the room ambient odour concentration is identified. The odour spot-check results at the downwind location are used to verify the modelling setting in general.
Table 3.25 Conversion Factors for Volume Sources and Wake-affected Point Sources
|
Pasquill Stability Class |
Conversion Factor (1 hour to 5
seconds) |
|
|
Wake-affected Point Source |
Volume Source |
|
|
A |
2.3 |
2.3 |
|
B |
2.3 |
2.3 |
|
C |
2.3 |
2.3 |
|
D |
2.3 |
2.3 |
|
E |
2.3 |
2.3 |
|
F |
2.3 |
2.3 |
3.9 Prediction and Evaluation of Environmental Impacts
Construction Phase
3.9.1 The cumulative air quality impact due to emissions from construction activities, open roads, ventilation building and tunnel portal of TMWB (for Scenario 2 only), industrial and port backup / logistics facilities at the Project sites and representative existing ASRs in Scenario 1: Year 2019-2030 and Scenario 2: Year 2031 to 2036 has been evaluated. In the Scenario 1, the predicted unmitigated cumulative maximum hourly average TSP, the 10th highest daily average and annual average RSP, the 10th highest daily average and annual average FSP concentrations at the Project sites and existing representative ASRs would be ranged from 173 – 25849 µg/m3, 91 – 1005 µg/m3, 40 – 77 µg/m3, 68 – 176 µg/m3, and 29 – 34 µg/m3, respectively. In Scenario 2, the predicted unmitigated cumulative maximum hourly average TSP, the 10th highest daily average and annual average RSP, the 10th highest daily average and annual average FSP concentrations at the Project sites and existing representative ASRs would be ranged from 198 – 18540 µg/m3, 86 – 616 µg/m3, 38 – 63 µg/m3, 69 – 149 µg/m3, and 29 – 33 µg/m3, respectively. It is noted that exceedance would be predicted at the ASRs which are located in proximity to the work sites. Mitigation measures are required for these ASRs. The detailed prediction unmitigated results in Scenarios 1 and 2 are presented in Appendix 3.9.
Operation Phase Air Quality
Year 2024 – 2030 Scenario
3.9.2 The cumulative air quality impact due to emissions from open roads, industrial and port backup / logistics facilities at the Project sites and representative existing ASRs in this scenario has been evaluated. The predicted unmitigated cumulative 19th highest hourly and annual average NO2, 4th highest 10-min and 4th highest daily average SO2, 10th highest daily and annual average RSP and FSP concentrations at the Project sites and representative existing ASRs are summarised in Table 3.26, Table 3.27, Table 3.28 and Table 3.29 respectively. The detailed results are presented in Appendix 3.10.
3.9.3 According to these result tables, the predicted NO2, RSP, FSP and SO2 concentrations at the representative planned ASRs within the Project sites and existing ASRs would comply with AQOs.
Table 3.26 Predicted Operational Air Quality Impact on Sites with Air Sensitive Use in Year 2024 – Year 2030
|
Site |
19th Highest Hourly NO2
Conc. (µg/m3) |
Annual NO2 Conc. (µg/m3) |
4th Highest 10-min SO2 Conc.
(µg/m3) |
4th Highest Daily SO2
Conc. (µg/m3) |
||||||||
|
2-18 |
94 |
- |
96 |
20 |
- |
20 |
132 |
- |
153 |
30 |
- |
30 |
|
2-19 |
96 |
- |
96 |
20 |
- |
20 |
132 |
- |
132 |
30 |
- |
30 |
|
3-43 |
96 |
- |
124 |
21 |
- |
33 |
134 |
- |
134 |
29 |
- |
29 |
|
3-44 |
96 |
- |
110 |
21 |
- |
27 |
134 |
- |
134 |
29 |
- |
29 |
|
3-45 |
96 |
- |
126 |
21 |
- |
34 |
134 |
- |
134 |
29 |
- |
29 |
|
3-50 |
96 |
- |
137 |
21 |
- |
35 |
127 |
- |
134 |
28 |
- |
29 |
|
3-51 |
96 |
- |
130 |
22 |
- |
32 |
127 |
- |
127 |
28 |
- |
28 |
|
3-6 |
90 |
- |
99 |
18 |
- |
21 |
132 |
- |
132 |
30 |
- |
30 |
|
3-7 |
90 |
- |
99 |
18 |
- |
23 |
132 |
- |
170 |
30 |
- |
32 |
|
3-8 |
90 |
- |
104 |
18 |
- |
23 |
131 |
- |
170 |
30 |
- |
33 |
|
4-20 |
110 |
- |
120 |
25 |
- |
28 |
127 |
- |
127 |
28 |
- |
28 |
|
4-22 |
91 |
- |
119 |
19 |
- |
30 |
127 |
- |
127 |
28 |
- |
28 |
|
4-28 |
86 |
- |
110 |
18 |
- |
30 |
111 |
- |
127 |
26 |
- |
28 |
|
5-16 |
92 |
- |
122 |
18 |
- |
36 |
110 |
- |
110 |
28 |
- |
28 |
|
5-17 |
91 |
- |
113 |
18 |
- |
32 |
110 |
- |
110 |
28 |
- |
28 |
|
5-18a |
91 |
- |
106 |
18 |
- |
26 |
110 |
- |
110 |
28 |
- |
28 |
|
5-18b |
91 |
- |
114 |
18 |
- |
31 |
110 |
- |
110 |
28 |
- |
28 |
|
5-2 |
94 |
- |
107 |
21 |
- |
27 |
111 |
- |
111 |
27 |
- |
27 |
|
5-21 |
95 |
- |
109 |
21 |
- |
27 |
110 |
- |
110 |
28 |
- |
28 |
|
5-22 |
91 |
- |
99 |
21 |
- |
27 |
117 |
- |
117 |
26 |
- |
26 |
|
5-23 |
91 |
- |
101 |
21 |
- |
25 |
117 |
- |
117 |
26 |
- |
26 |
|
5-24 |
88 |
- |
101 |
18 |
- |
26 |
117 |
- |
117 |
26 |
- |
26 |
|
5-26 |
88 |
- |
102 |
19 |
- |
26 |
117 |
- |
117 |
26 |
- |
26 |
|
5-27 |
95 |
- |
104 |
22 |
- |
27 |
117 |
- |
117 |
26 |
- |
26 |
|
5-28 |
95 |
- |
105 |
22 |
- |
27 |
117 |
- |
117 |
26 |
- |
26 |
|
5-32 |
88 |
- |
119 |
18 |
- |
33 |
117 |
- |
117 |
26 |
- |
26 |
|
5-33 |
92 |
- |
103 |
21 |
- |
26 |
117 |
- |
117 |
26 |
- |
26 |
|
5-3a |
91 |
- |
112 |
18 |
- |
26 |
110 |
- |
111 |
27 |
- |
28 |
|
5-3b |
92 |
- |
104 |
20 |
- |
25 |
111 |
- |
111 |
27 |
- |
27 |
|
5-6 |
102 |
- |
104 |
23 |
- |
25 |
111 |
- |
111 |
27 |
- |
27 |
Note: Bolded and underlined figure represents exceedance of relevant
AQOs. The range of the results
means the predicted concentrations at the ASRs within the site at all
assessment heights.
Table 3.27 Predicted Operational Air Quality Impact on Representative Existing ASRs in Year 2024 – Year 2030
|
ASR
ID |
19th Highest Hourly NO2
Conc. (µg/m3) |
Annual NO2 Conc. (µg/m3) |
4th Highest 10-min SO2 Conc.
(µg/m3) |
4th Highest Daily SO2
Conc. (µg/m3) |
||||||||
|
A1001 |
97 |
- |
97 |
21 |
- |
21 |
132 |
- |
132 |
30 |
- |
30 |
|
A1002 |
96 |
- |
96 |
20 |
- |
20 |
132 |
- |
132 |
30 |
- |
30 |
|
A1003 |
96 |
- |
96 |
20 |
- |
20 |
132 |
- |
132 |
30 |
- |
30 |
|
A1004 |
94 |
- |
94 |
20 |
- |
20 |
132 |
- |
132 |
30 |
- |
30 |
|
A1005 |
95 |
- |
96 |
20 |
- |
20 |
132 |
- |
132 |
30 |
- |
30 |
|
A102 |
96 |
- |
114 |
21 |
- |
31 |
114 |
- |
114 |
26 |
- |
26 |
|
A103 |
99 |
- |
107 |
23 |
- |
29 |
114 |
- |
114 |
26 |
- |
26 |
|
A104 |
106 |
- |
107 |
27 |
- |
28 |
114 |
- |
114 |
26 |
- |
26 |
|
A105 |
106 |
- |
120 |
26 |
- |
32 |
114 |
- |
114 |
26 |
- |
26 |
|
A106 |
111 |
- |
114 |
28 |
- |
30 |
114 |
- |
114 |
26 |
- |
26 |
|
A107 |
109 |
- |
110 |
28 |
- |
28 |
114 |
- |
114 |
26 |
- |
26 |
|
A108 |
107 |
- |
107 |
27 |
- |
27 |
114 |
- |
114 |
26 |
- |
26 |
|
A109 |
102 |
- |
102 |
25 |
- |
25 |
114 |
- |
114 |
26 |
- |
26 |
|
A110 |
113 |
- |
113 |
28 |
- |
28 |
114 |
- |
114 |
26 |
- |
26 |
|
A1101 |
99 |
- |
102 |
24 |
- |
25 |
131 |
- |
131 |
29 |
- |
29 |
|
A1102 |
98 |
- |
100 |
23 |
- |
23 |
131 |
- |
131 |
29 |
- |
29 |
|
A1103 |
92 |
- |
104 |
18 |
- |
23 |
131 |
- |
131 |
29 |
- |
29 |
|
A1104 |
92 |
- |
104 |
18 |
- |
22 |
131 |
- |
131 |
29 |
- |
29 |
|
A1105 |
92 |
- |
101 |
18 |
- |
23 |
131 |
- |
131 |
29 |
- |
29 |
|
A1106 |
92 |
- |
101 |
18 |
- |
22 |
131 |
- |
131 |
29 |
- |
29 |
|
A1107 |
92 |
- |
102 |
18 |
- |
24 |
131 |
- |
131 |
29 |
- |
29 |
|
A1108 |
94 |
- |
101 |
20 |
- |
22 |
131 |
- |
131 |
29 |
- |
29 |
|
A1109 |
92 |
- |
111 |
18 |
- |
24 |
131 |
- |
131 |
29 |
- |
29 |
|
A111 |
108 |
- |
108 |
26 |
- |
26 |
114 |
- |
114 |
26 |
- |
26 |
|
A112 |
110 |
- |
110 |
26 |
- |
26 |
114 |
- |
114 |
26 |
- |
26 |
|
A1201 |
99 |
- |
113 |
20 |
- |
29 |
110 |
- |
110 |
27 |
- |
27 |
|
A1202 |
99 |
- |
108 |
20 |
- |
26 |
110 |
- |
110 |
27 |
- |
27 |
|
A1203 |
99 |
- |
118 |
20 |
- |
28 |
110 |
- |
110 |
27 |
- |
27 |
|
A1300 |
100 |
- |
101 |
20 |
- |
20 |
256 |
- |
256 |
36 |
- |
36 |
|
A1301 |
92 |
- |
93 |
19 |
- |
19 |
153 |
- |
153 |
30 |
- |
30 |
|
A1302 |
93 |
- |
95 |
20 |
- |
21 |
153 |
- |
153 |
30 |
- |
30 |
|
A1303 |
100 |
- |
104 |
22 |
- |
24 |
153 |
- |
153 |
30 |
- |
30 |
|
A1304 |
98 |
- |
107 |
21 |
- |
24 |
153 |
- |
153 |
30 |
- |
30 |
|
A1305 |
99 |
- |
110 |
20 |
- |
24 |
153 |
- |
153 |
30 |
- |
30 |
|
A1306 |
100 |
- |
105 |
20 |
- |
22 |
153 |
- |
153 |
30 |
- |
30 |
|
A1307 |
93 |
- |
95 |
20 |
- |
20 |
153 |
- |
153 |
30 |
- |
30 |
|
A1308 |
96 |
- |
102 |
19 |
- |
20 |
153 |
- |
153 |
30 |
- |
30 |
|
A1309 |
93 |
- |
95 |
19 |
- |
19 |
153 |
- |
153 |
30 |
- |
30 |
|
A1401 |
94 |
- |
95 |
20 |
- |
20 |
126 |
- |
126 |
29 |
- |
29 |
|
A1402 |
91 |
- |
102 |
18 |
- |
23 |
126 |
- |
126 |
29 |
- |
29 |
|
A1403 |
91 |
- |
100 |
18 |
- |
22 |
126 |
- |
126 |
29 |
- |
29 |
|
A1404 |
91 |
- |
102 |
17 |
- |
21 |
126 |
- |
126 |
29 |
- |
29 |
|
A1405 |
91 |
- |
101 |
17 |
- |
21 |
126 |
- |
126 |
29 |
- |
29 |
|
A1501 |
98 |
- |
98 |
22 |
- |
22 |
131 |
- |
131 |
33 |
- |
33 |
|
A201 |
105 |
- |
105 |
25 |
- |
25 |
127 |
- |
127 |
28 |
- |
28 |
|
A202 |
111 |
- |
112 |
26 |
- |
27 |
127 |
- |
127 |
28 |
- |
28 |
|
A203 |
112 |
- |
114 |
26 |
- |
27 |
127 |
- |
127 |
28 |
- |
28 |
|
A204 |
110 |
- |
116 |
26 |
- |
28 |
127 |
- |
127 |
28 |
- |
28 |
|
A205 |
110 |
- |
113 |
26 |
- |
27 |
127 |
- |
127 |
28 |
- |
28 |
|
A206 |
110 |
- |
111 |
30 |
- |
31 |
127 |
- |
127 |
28 |
- |
28 |
|
A207 |
100 |
- |
102 |
25 |
- |
25 |
127 |
- |
127 |
28 |
- |
28 |
|
A208 |
111 |
- |
111 |
29 |
- |
29 |
127 |
- |
127 |
28 |
- |
28 |
|
A209 |
110 |
- |
113 |
26 |
- |
29 |
127 |
- |
127 |
28 |
- |
28 |
|
A301 |
98 |
- |
100 |
24 |
- |
24 |
111 |
- |
111 |
26 |
- |
26 |
|
A302 |
100 |
- |
100 |
24 |
- |
25 |
111 |
- |
111 |
26 |
- |
26 |
|
A303 |
99 |
- |
101 |
24 |
- |
24 |
111 |
- |
111 |
26 |
- |
26 |
|
A304 |
99 |
- |
100 |
24 |
- |
25 |
111 |
- |
111 |
26 |
- |
26 |
|
A305 |
102 |
- |
103 |
25 |
- |
25 |
111 |
- |
111 |
26 |
- |
26 |
|
A306 |
97 |
- |
99 |
24 |
- |
25 |
111 |
- |
111 |
26 |
- |
26 |
|
A307 |
101 |
- |
107 |
24 |
- |
25 |
111 |
- |
111 |
26 |
- |
26 |
|
A308 |
100 |
- |
109 |
25 |
- |
25 |
111 |
- |
111 |
26 |
- |
26 |
|
A309 |
98 |
- |
103 |
24 |
- |
24 |
111 |
- |
111 |
26 |
- |
26 |
|
A310 |
108 |
- |
108 |
30 |
- |
30 |
111 |
- |
111 |
26 |
- |
26 |
|
A311 |
97 |
- |
103 |
23 |
- |
26 |
111 |
- |
111 |
26 |
- |
26 |
|
A312 |
101 |
- |
103 |
25 |
- |
26 |
111 |
- |
111 |
26 |
- |
26 |
|
A313 |
98 |
- |
107 |
23 |
- |
28 |
111 |
- |
111 |
26 |
- |
26 |
|
A314 |
96 |
- |
108 |
23 |
- |
28 |
111 |
- |
111 |
26 |
- |
26 |
|
A401 |
96 |
- |
99 |
23 |
- |
24 |
117 |
- |
117 |
26 |
- |
26 |
|
A402 |
98 |
- |
99 |
24 |
- |
27 |
117 |
- |
117 |
26 |
- |
26 |
|
A403 |
94 |
- |
102 |
21 |
- |
27 |
117 |
- |
117 |
26 |
- |
26 |
|
A404 |
98 |
- |
105 |
24 |
- |
26 |
117 |
- |
117 |
26 |
- |
26 |
|
A405 |
93 |
- |
103 |
22 |
- |
27 |
117 |
- |
117 |
26 |
- |
26 |
|
A406 |
98 |
- |
105 |
24 |
- |
28 |
117 |
- |
117 |
26 |
- |
26 |
|
A407 |
98 |
- |
101 |
24 |
- |
27 |
117 |
- |
117 |
26 |
- |
26 |
|
A408 |
97 |
- |
98 |
23 |
- |
23 |
117 |
- |
117 |
26 |
- |
26 |
|
A409 |
93 |
- |
108 |
21 |
- |
30 |
117 |
- |
117 |
26 |
- |
26 |
|
A410 |
96 |
- |
98 |
23 |
- |
24 |
117 |
- |
117 |
26 |
- |
26 |
|
A411 |
99 |
- |
100 |
25 |
- |
25 |
117 |
- |
117 |
26 |
- |
26 |
|
A412 |
96 |
- |
98 |
23 |
- |
24 |
117 |
- |
117 |
26 |
- |
26 |
|
A413 |
106 |
- |
110 |
27 |
- |
29 |
117 |
- |
117 |
26 |
- |
26 |
|
A414 |
98 |
- |
99 |
24 |
- |
24 |
117 |
- |
117 |
26 |
- |
26 |
|
A415 |
96 |
- |
96 |
23 |
- |
23 |
117 |
- |
117 |
26 |
- |
26 |
|
A416 |
94 |
- |
103 |
21 |
- |
26 |
117 |
- |
117 |
26 |
- |
26 |
|
A502 |
92 |
- |
116 |
21 |
- |
31 |
118 |
- |
118 |
26 |
- |
26 |
|
A503 |
105 |
- |
114 |
27 |
- |
30 |
118 |
- |
118 |
26 |
- |
26 |
|
A504 |
106 |
- |
109 |
25 |
- |
26 |
118 |
- |
118 |
26 |
- |
26 |
|
A505 |
105 |
- |
106 |
23 |
- |
24 |
118 |
- |
118 |
26 |
- |
26 |
|
A506 |
101 |
- |
101 |
24 |
- |
24 |
118 |
- |
118 |
26 |
- |
26 |
|
A507 |
99 |
- |
105 |
22 |
- |
26 |
118 |
- |
118 |
26 |
- |
26 |
|
A508 |
101 |
- |
106 |
22 |
- |
26 |
118 |
- |
118 |
26 |
- |
26 |
|
A601 |
99 |
- |
99 |
21 |
- |
21 |
119 |
- |
119 |
30 |
- |
30 |
|
A602 |
100 |
- |
100 |
25 |
- |
25 |
119 |
- |
119 |
30 |
- |
30 |
|
A603 |
101 |
- |
101 |
24 |
|
24 |
119 |
- |
119 |
30 |
- |
30 |
|
A701 |
97 |
- |
102 |
23 |
|
26 |
110 |
- |
110 |
28 |
- |
28 |
|
A702 |
100 |
- |
109 |
24 |
|
26 |
110 |
- |
110 |
28 |
- |
28 |
|
A703 |
102 |
- |
103 |
25 |
|
26 |
110 |
- |
110 |
28 |
- |
28 |
|
A704 |
101 |
- |
102 |
25 |
|
26 |
110 |
- |
110 |
28 |
- |
28 |
|
A705 |
107 |
- |
111 |
25 |
|
26 |
110 |
- |
110 |
28 |
- |
28 |
|
A706 |
103 |
- |
104 |
23 |
|
24 |
110 |
- |
110 |
28 |
- |
28 |
|
A707 |
96 |
- |
109 |
20 |
|
24 |
110 |
- |
110 |
28 |
- |
28 |
|
A708 |
97 |
- |
97 |
22 |
|
23 |
110 |
- |
110 |
28 |
- |
28 |
|
A801 |
102 |
- |
102 |
23 |
|
24 |
111 |
- |
111 |
27 |
- |
27 |
|
A802 |
102 |
- |
102 |
23 |
|
23 |
111 |
- |
111 |
27 |
- |
27 |
|
A803 |
98 |
- |
102 |
22 |
|
23 |
111 |
- |
111 |
27 |
- |
27 |
|
A804 |
101 |
- |
102 |
22 |
|
23 |
111 |
- |
111 |
27 |
- |
27 |
|
A805 |
101 |
- |
105 |
22 |
|
25 |
111 |
- |
111 |
27 |
- |
27 |
|
A806 |
101 |
- |
101 |
21 |
|
22 |
111 |
- |
111 |
27 |
- |
27 |
|
A807 |
101 |
- |
102 |
22 |
|
22 |
111 |
- |
111 |
27 |
- |
27 |
|
A808 |
98 |
- |
116 |
22 |
|
30 |
111 |
- |
111 |
27 |
- |
27 |
|
A809 |
97 |
- |
105 |
21 |
|
24 |
111 |
- |
111 |
27 |
- |
27 |
|
A810 |
97 |
- |
105 |
21 |
|
24 |
111 |
- |
111 |
27 |
- |
27 |
|
A811 |
96 |
- |
111 |
21 |
|
27 |
111 |
- |
111 |
27 |
- |
27 |
|
A812 |
92 |
- |
106 |
20 |
|
26 |
111 |
- |
111 |
27 |
- |
27 |
|
A813 |
92 |
- |
111 |
20 |
|
26 |
111 |
- |
111 |
27 |
- |
27 |
|
A901 |
97 |
- |
97 |
22 |
|
22 |
170 |
- |
170 |
32 |
- |
32 |
|
A902 |
96 |
- |
97 |
20 |
|
20 |
170 |
- |
170 |
32 |
- |
32 |
|
A903 |
97 |
- |
97 |
20 |
|
20 |
170 |
- |
170 |
32 |
- |
32 |
Note: Bolded and underlined figure represents exceedance of relevant
AQOs. The range of the results
means the predicted concentrations at the ASRs within the site at all
assessment heights.
Table 3.28 Predicted Operational Air Quality Impact (Particulates) on Sites with Air Sensitive Use in Year 2024 – Year 2030
|
Site |
10th Highest Daily RSP
Conc. (µg/m3) |
Annual RSP Conc. (µg/m3) |
10th Highest Daily FSP Conc. (µg/m3) |
Annual FSP Conc. (µg/m3) |
||||||||
|
2-18 |
92 |
- |
94 |
41 |
- |
42 |
69 |
- |
71 |
29 |
- |
30 |
|
2-19 |
94 |
- |
94 |
42 |
- |
42 |
71 |
- |
71 |
30 |
- |
30 |
|
3-43 |
94 |
- |
95 |
42 |
- |
43 |
70 |
- |
71 |
30 |
- |
30 |
|
3-44 |
94 |
- |
99 |
42 |
- |
44 |
70 |
- |
71 |
30 |
- |
30 |
|
3-45 |
94 |
- |
98 |
42 |
- |
43 |
70 |
- |
71 |
30 |
- |
31 |
|
3-50 |
93 |
- |
95 |
42 |
- |
43 |
70 |
- |
71 |
30 |
- |
31 |
|
3-51 |
93 |
- |
93 |
42 |
- |
42 |
70 |
- |
70 |
30 |
- |
30 |
|
3-6 |
94 |
- |
94 |
42 |
- |
42 |
71 |
- |
71 |
30 |
- |
30 |
|
3-7 |
94 |
- |
95 |
42 |
- |
42 |
71 |
- |
72 |
30 |
- |
30 |
|
3-8 |
94 |
- |
97 |
42 |
- |
43 |
71 |
- |
73 |
30 |
- |
30 |
|
4-20 |
93 |
- |
93 |
42 |
- |
42 |
70 |
- |
70 |
30 |
- |
30 |
|
4-22 |
93 |
- |
93 |
42 |
- |
42 |
70 |
- |
70 |
30 |
- |
30 |
|
4-28 |
93 |
- |
93 |
42 |
- |
43 |
70 |
- |
70 |
30 |
- |
30 |
|
5-16 |
92 |
- |
93 |
41 |
- |
41 |
69 |
- |
70 |
29 |
- |
30 |
|
5-17 |
92 |
- |
92 |
41 |
- |
41 |
69 |
- |
69 |
29 |
- |
29 |
|
5-18a |
92 |
- |
92 |
41 |
- |
41 |
69 |
- |
69 |
29 |
- |
29 |
|
5-18b |
92 |
- |
92 |
41 |
- |
41 |
69 |
- |
69 |
29 |
- |
29 |
|
5-2 |
92 |
- |
92 |
41 |
- |
41 |
69 |
- |
69 |
29 |
- |
29 |
|
5-21 |
92 |
- |
92 |
41 |
- |
41 |
69 |
- |
69 |
29 |
- |
29 |
|
5-22 |
92 |
- |
92 |
41 |
- |
41 |
69 |
- |
69 |
29 |
- |
29 |
|
5-23 |
92 |
- |
92 |
41 |
- |
41 |
69 |
- |
69 |
29 |
- |
29 |
|
5-24 |
92 |
- |
92 |
41 |
- |
41 |
69 |
- |
69 |
29 |
- |
29 |
|
5-26 |
92 |
- |
92 |
41 |
- |
41 |
69 |
- |
69 |
29 |
- |
29 |
|
5-27 |
92 |
- |
92 |
41 |
- |
41 |
69 |
- |
69 |
29 |
- |
29 |
|
5-28 |
92 |
- |
92 |
41 |
- |
41 |
69 |
- |
69 |
29 |
- |
29 |
|
5-32 |
92 |
- |
93 |
41 |
- |
42 |
69 |
- |
70 |
29 |
- |
30 |
|
5-33 |
92 |
- |
92 |
41 |
- |
41 |
69 |
- |
69 |
29 |
- |
29 |
|
5-3a |
92 |
- |
92 |
41 |
- |
41 |
69 |
- |
69 |
29 |
- |
29 |
|
5-3b |
92 |
- |
92 |
41 |
- |
41 |
69 |
- |
69 |
29 |
- |
29 |
|
5-6 |
92 |
- |
92 |
41 |
- |
41 |
69 |
- |
69 |
29 |
- |
29 |
Note: Bolded and underlined figure represents exceedance of relevant
AQO. The range of the results means
the predicted concentrations at the ASRs within the site at all assessment
heights.
Table 3.29 Predicted Operational Air Quality Impact (Particulates) on Representative Existing ASRs in Year 2024 – Year 2030
|
ASR
ID |
10th Highest Daily RSP
Conc. (µg/m3) |
Annual RSP Conc. (µg/m3) |
10th Highest Daily FSP Conc. (µg/m3) |
Annual FSP Conc. (µg/m3) |
||||||||
|
A1001 |
94 |
- |
94 |
42 |
- |
42 |
71 |
- |
71 |
30 |
- |
30 |
|
A1002 |
94 |
- |
94 |
42 |
- |
42 |
71 |
- |
71 |
30 |
- |
30 |
|
A1003 |
94 |
- |
94 |
42 |
- |
42 |
71 |
- |
71 |
30 |
- |
30 |
|
A1004 |
94 |
- |
94 |
42 |
- |
42 |
71 |
- |
71 |
30 |
- |
30 |
|
A1005 |
94 |
- |
94 |
42 |
- |
42 |
71 |
- |
71 |
30 |
- |
30 |
|
A102 |
93 |
- |
93 |
42 |
- |
43 |
70 |
- |
70 |
30 |
- |
30 |
|
A103 |
93 |
- |
93 |
42 |
- |
42 |
70 |
- |
70 |
30 |
- |
30 |
|
A104 |
93 |
- |
93 |
42 |
- |
42 |
70 |
- |
70 |
30 |
- |
30 |
|
A105 |
93 |
- |
93 |
42 |
- |
43 |
70 |
- |
70 |
30 |
- |
30 |
|
A106 |
93 |
- |
93 |
42 |
- |
43 |
70 |
- |
70 |
30 |
- |
30 |
|
A107 |
93 |
- |
93 |
42 |
- |
42 |
70 |
- |
70 |
30 |
- |
30 |
|
A108 |
93 |
- |
93 |
42 |
- |
42 |
70 |
- |
70 |
30 |
- |
30 |
|
A109 |
93 |
- |
93 |
42 |
- |
42 |
70 |
- |
70 |
30 |
- |
30 |
|
A110 |
93 |
- |
93 |
42 |
- |
42 |
70 |
- |
70 |
30 |
- |
30 |
|
A1101 |
92 |
- |
92 |
41 |
- |
41 |
69 |
- |
69 |
29 |
- |
29 |
|
A1102 |
92 |
- |
92 |
41 |
- |
41 |
69 |
- |
69 |
29 |
- |
29 |
|
A1103 |
92 |
- |
92 |
41 |
- |
41 |
69 |
- |
69 |
29 |
- |
29 |
|
A1104 |
92 |
- |
92 |
41 |
- |
41 |
69 |
- |
69 |
29 |
- |
29 |
|
A1105 |
92 |
- |
92 |
41 |
- |
41 |
69 |
- |
69 |
29 |
- |
29 |
|
A1106 |
92 |
- |
92 |
41 |
- |
41 |
69 |
- |
69 |
29 |
- |
29 |
|
A1107 |
92 |
- |
92 |
41 |
- |
41 |
69 |
- |
69 |
29 |
- |
29 |
|
A1108 |
92 |
- |
92 |
41 |
- |
41 |
69 |
- |
69 |
29 |
- |
29 |
|
A1109 |
92 |
- |
92 |
41 |
- |
41 |
69 |
- |
69 |
29 |
- |
29 |
|
A111 |
93 |
- |
93 |
42 |
- |
42 |
70 |
- |
70 |
30 |
- |
30 |
|
A112 |
93 |
- |
93 |
42 |
- |
42 |
70 |
- |
70 |
30 |
- |
30 |
|
A1201 |
92 |
- |
92 |
41 |
- |
41 |
69 |
- |
69 |
29 |
- |
29 |
|
A1202 |
92 |
- |
92 |
41 |
- |
41 |
69 |
- |
69 |
29 |
- |
29 |
|
A1203 |
92 |
- |
92 |
41 |
- |
41 |
69 |
- |
69 |
29 |
- |
29 |
|
A1300 |
93 |
- |
93 |
41 |
- |
41 |
70 |
- |
70 |
29 |
- |
29 |
|
A1301 |
92 |
- |
92 |
41 |
- |
41 |
69 |
- |
69 |
29 |
- |
29 |
|
A1302 |
92 |
- |
92 |
41 |
- |
41 |
69 |
- |
69 |
29 |
- |
29 |
|
A1303 |
92 |
- |
92 |
41 |
- |
41 |
69 |
- |
69 |
29 |
- |
29 |
|
A1304 |
92 |
- |
92 |
41 |
- |
41 |
69 |
- |
69 |
29 |
- |
29 |
|
A1305 |
92 |
- |
92 |
41 |
- |
41 |
69 |
- |
69 |
29 |
- |
29 |
|
A1306 |
92 |
- |
92 |
41 |
- |
41 |
69 |
- |
69 |
29 |
- |
29 |
|
A1307 |
92 |
- |
92 |
41 |
- |
41 |
69 |
- |
69 |
29 |
- |
29 |
|
A1308 |
92 |
- |
92 |
41 |
- |
41 |
69 |
- |
69 |
29 |
- |
29 |
|
A1309 |
92 |
- |
92 |
41 |
- |
41 |
69 |
- |
69 |
29 |
- |
29 |
|
A1401 |
91 |
- |
91 |
41 |
- |
41 |
69 |
- |
69 |
29 |
- |
29 |
|
A1402 |
91 |
- |
92 |
40 |
- |
41 |
68 |
- |
69 |
29 |
- |
29 |
|
A1403 |
91 |
- |
91 |
40 |
- |
41 |
68 |
- |
69 |
29 |
- |
29 |
|
A1404 |
91 |
- |
91 |
40 |
- |
41 |
68 |
- |
69 |
29 |
- |
29 |
|
A1405 |
91 |
- |
92 |
40 |
- |
41 |
68 |
- |
69 |
29 |
- |
29 |
|
A1501 |
97 |
- |
97 |
43 |
- |
43 |
73 |
- |
73 |
30 |
- |
30 |
|
A201 |
93 |
- |
93 |
42 |
- |
42 |
70 |
- |
70 |
30 |
- |
30 |
|
A202 |
93 |
- |
93 |
42 |
- |
42 |
70 |
- |
70 |
30 |
- |
30 |
|
A203 |
93 |
- |
93 |
42 |
- |
42 |
70 |
- |
70 |
30 |
- |
30 |
|
A204 |
93 |
- |
93 |
42 |
- |
42 |
70 |
- |
70 |
30 |
- |
30 |
|
A205 |
93 |
- |
93 |
42 |
- |
42 |
70 |
- |
70 |
30 |
- |
30 |
|
A206 |
94 |
- |
94 |
42 |
- |
42 |
70 |
- |
70 |
30 |
- |
30 |
|
A207 |
93 |
- |
93 |
42 |
- |
42 |
70 |
- |
70 |
30 |
- |
30 |
|
A208 |
93 |
- |
93 |
42 |
- |
42 |
70 |
- |
70 |
30 |
- |
30 |
|
A209 |
93 |
- |
93 |
42 |
- |
42 |
70 |
- |
70 |
30 |
- |
30 |
|
A301 |
93 |
- |
93 |
42 |
- |
42 |
70 |
- |
70 |
30 |
- |
30 |
|
A302 |
93 |
- |
93 |
42 |
- |
42 |
70 |
- |
70 |
30 |
- |
30 |
|
A303 |
93 |
- |
93 |
42 |
- |
42 |
70 |
- |
70 |
30 |
- |
30 |
|
A304 |
93 |
- |
93 |
42 |
- |
42 |
70 |
- |
70 |
30 |
- |
30 |
|
A305 |
93 |
- |
93 |
42 |
- |
42 |
70 |
- |
70 |
30 |
- |
30 |
|
A306 |
93 |
- |
93 |
42 |
- |
42 |
70 |
- |
70 |
30 |
- |
30 |
|
A307 |
93 |
- |
93 |
42 |
- |
42 |
70 |
- |
70 |
30 |
- |
30 |
|
A308 |
93 |
- |
93 |
42 |
- |
42 |
70 |
- |
70 |
30 |
- |
30 |
|
A309 |
93 |
- |
93 |
42 |
- |
42 |
70 |
- |
70 |
30 |
- |
30 |
|
A310 |
93 |
- |
93 |
43 |
- |
43 |
70 |
- |
70 |
30 |
- |
30 |
|
A311 |
93 |
- |
93 |
42 |
- |
42 |
70 |
- |
70 |
30 |
- |
30 |
|
A312 |
93 |
- |
93 |
42 |
- |
42 |
70 |
- |
70 |
30 |
- |
30 |
|
A313 |
93 |
- |
93 |
42 |
- |
42 |
70 |
- |
70 |
30 |
- |
30 |
|
A314 |
93 |
- |
93 |
42 |
- |
42 |
70 |
- |
70 |
30 |
- |
30 |
|
A401 |
92 |
- |
92 |
41 |
- |
41 |
69 |
- |
69 |
29 |
- |
29 |
|
A402 |
92 |
- |
92 |
41 |
- |
41 |
69 |
- |
69 |
29 |
- |
29 |
|
A403 |
92 |
- |
92 |
41 |
- |
41 |
69 |
- |
69 |
29 |
- |
29 |
|
A404 |
92 |
- |
92 |
41 |
- |
41 |
69 |
- |
69 |
29 |
- |
29 |
|
A405 |
92 |
- |
92 |
41 |
- |
41 |
69 |
- |
69 |
29 |
- |
29 |
|
A406 |
92 |
- |
92 |
41 |
- |
41 |
69 |
- |
69 |
29 |
- |
29 |
|
A407 |
92 |
- |
92 |
41 |
- |
41 |
69 |
- |
69 |
29 |
- |
29 |
|
A408 |
92 |
- |
92 |
41 |
- |
41 |
69 |
- |
69 |
29 |
- |
29 |
|
A409 |
92 |
- |
92 |
41 |
- |
41 |
69 |
- |
69 |
29 |
- |
30 |
|
A410 |
92 |
- |
92 |
41 |
- |
41 |
69 |
- |
69 |
29 |
- |
29 |
|
A411 |
92 |
- |
92 |
41 |
- |
41 |
69 |
- |
69 |
29 |
- |
29 |
|
A412 |
92 |
- |
92 |
41 |
- |
41 |
69 |
- |
69 |
29 |
- |
29 |
|
A413 |
92 |
- |
92 |
41 |
- |
41 |
69 |
- |
69 |
29 |
- |
30 |
|
A414 |
92 |
- |
92 |
41 |
- |
41 |
69 |
- |
69 |
29 |
- |
29 |
|
A415 |
92 |
- |
92 |
41 |
- |
41 |
69 |
- |
69 |
29 |
- |
29 |
|
A416 |
92 |
- |
92 |
41 |
- |
41 |
69 |
- |
69 |
29 |
- |
29 |
|
A502 |
92 |
- |
93 |
41 |
- |
42 |
69 |
- |
70 |
29 |
- |
30 |
|
A503 |
93 |
- |
93 |
42 |
- |
42 |
70 |
- |
70 |
30 |
- |
30 |
|
A504 |
92 |
- |
92 |
42 |
- |
42 |
69 |
- |
69 |
30 |
- |
30 |
|
A505 |
92 |
- |
92 |
42 |
- |
42 |
69 |
- |
69 |
29 |
- |
29 |
|
A506 |
92 |
- |
92 |
42 |
- |
42 |
69 |
- |
69 |
29 |
- |
29 |
|
A507 |
92 |
- |
92 |
41 |
- |
42 |
69 |
- |
69 |
29 |
- |
29 |
|
A508 |
92 |
- |
92 |
41 |
- |
42 |
69 |
- |
69 |
29 |
- |
29 |
|
A601 |
94 |
- |
94 |
41 |
- |
41 |
70 |
- |
70 |
29 |
- |
29 |
|
A602 |
94 |
- |
94 |
42 |
- |
42 |
71 |
- |
71 |
30 |
- |
30 |
|
A603 |
94 |
- |
94 |
42 |
|
42 |
71 |
- |
71 |
30 |
- |
30 |
|
A701 |
92 |
- |
92 |
41 |
|
41 |
69 |
- |
69 |
29 |
- |
29 |
|
A702 |
92 |
- |
92 |
41 |
|
41 |
69 |
- |
69 |
29 |
- |
29 |
|
A703 |
92 |
- |
92 |
41 |
|
41 |
69 |
- |
69 |
29 |
- |
29 |
|
A704 |
92 |
- |
92 |
41 |
|
41 |
69 |
- |
69 |
29 |
- |
29 |
|
A705 |
92 |
- |
92 |
41 |
|
41 |
69 |
- |
69 |
29 |
- |
29 |
|
A706 |
92 |
- |
92 |
41 |
|
41 |
69 |
- |
69 |
29 |
- |
29 |
|
A707 |
92 |
- |
92 |
41 |
|
41 |
69 |
- |
69 |
29 |
- |
29 |
|
A708 |
92 |
- |
92 |
41 |
|
41 |
69 |
- |
69 |
29 |
- |
29 |
|
A801 |
92 |
- |
92 |
41 |
|
41 |
69 |
- |
69 |
29 |
- |
29 |
|
A802 |
92 |
- |
92 |
41 |
|
41 |
69 |
- |
69 |
29 |
- |
29 |
|
A803 |
92 |
- |
92 |
41 |
|
41 |
69 |
- |
69 |
29 |
- |
29 |
|
A804 |
92 |
- |
92 |
41 |
|
41 |
69 |
- |
69 |
29 |
- |
29 |
|
A805 |
92 |
- |
92 |
41 |
|
41 |
69 |
- |
69 |
29 |
- |
29 |
|
A806 |
92 |
- |
92 |
41 |
|
41 |
69 |
- |
69 |
29 |
- |
29 |
|
A807 |
92 |
- |
92 |
41 |
|
41 |
69 |
- |
69 |
29 |
- |
29 |
|
A808 |
92 |
- |
92 |
41 |
|
41 |
69 |
- |
69 |
29 |
- |
29 |
|
A809 |
92 |
- |
92 |
41 |
|
41 |
69 |
- |
69 |
29 |
- |
29 |
|
A810 |
92 |
- |
92 |
41 |
|
41 |
69 |
- |
69 |
29 |
- |
29 |
|
A811 |
92 |
- |
92 |
41 |
|
41 |
69 |
- |
69 |
29 |
- |
29 |
|
A812 |
92 |
- |
92 |
41 |
|
41 |
69 |
- |
69 |
29 |
- |
29 |
|
A813 |
92 |
- |
92 |
41 |
|
41 |
69 |
- |
69 |
29 |
- |
29 |
|
A901 |
95 |
- |
95 |
42 |
|
42 |
72 |
- |
72 |
30 |
- |
30 |
|
A902 |
95 |
- |
95 |
42 |
|
42 |
71 |
- |
71 |
30 |
- |
30 |
|
A903 |
95 |
- |
95 |
42 |
|
42 |
71 |
- |
71 |
30 |
- |
30 |
Note: Bolded and underlined figure represents exceedance of relevant
AQOs. The range of the results
means the predicted concentrations at the ASRs within the site at all
assessment heights.
3.9.4 According to the assessment results, the worst hit level generally appears at 1.5 meters above ground (mAG) of the receptors. As NO2 and particulates are considered the potential key air pollutant associated with the operation of the Project, the contour plots for NO2, RSP and FSP are presented. The contour plot of 19th highest hourly average and annual average NO2 concentrations at 1.5 mAG are illustrated in Figure 3.4 and Figure 3.5. The contour plot of 10th highest daily average and annual average RSP concentrations at 1.5 mAG are illustrated in Figure 3.8 and Figure 3.9. The contour plot of 10th highest daily average and annual average FSP concentrations at 1.5 mAG are illustrated in Figure 3.10 and Figure 3.11. Referring to the contour plots, no existing ASRs and planned ASRs occupied during Year 2024 - 2030 are found exceedance of AQOs.
Year 2031 – 2039 Scenario
3.9.5 The cumulative air quality impact due to emissions from open roads, ventilation building and tunnel portal of TMWB, planned hospital, industrial and port backup / logistics facilities at the Project sites and representative existing ASRs in this scenario has been evaluated. The predicted unmitigated cumulative 19th highest hourly and annual average NO2, 4th highest 10-min and 4th highest daily average SO2, 10th highest daily and annual average RSP and FSP concentrations at the Project sites and representative existing ASRs are summarised in Table 3.30, Table 3.31, Table 3.32 and Table 3.33 respectively. The detailed results are presented in Appendix 3.10. Results indicate that all representative existing and planned ASRs would comply with the AQOs.
Table 3.30 Predicted Operational Air Quality Impact on Sites with Air Sensitive Use in Year 2031 – Year 2039
|
Site |
19th Highest Hourly NO2
Conc. (µg/m3) |
Annual NO2 Conc. (µg/m3) |
4th Highest 10-min SO2 Conc.
(µg/m3) |
4th Highest Daily SO2
Conc. (µg/m3) |
||||||||
|
1-1 |
91 |
- |
99 |
18 |
- |
21 |
126 |
- |
131 |
29 |
- |
29 |
|
1-12 |
92 |
- |
98 |
18 |
- |
21 |
131 |
- |
131 |
29 |
- |
29 |
|
1-13 |
91 |
- |
97 |
18 |
- |
21 |
110 |
- |
131 |
28 |
- |
29 |
|
1-15 |
94 |
- |
99 |
19 |
- |
21 |
110 |
- |
110 |
28 |
- |
28 |
|
1-16 |
91 |
- |
98 |
18 |
- |
21 |
110 |
- |
110 |
28 |
- |
28 |
|
1-17 |
91 |
- |
99 |
18 |
- |
21 |
110 |
- |
110 |
28 |
- |
28 |
|
1-18 |
95 |
- |
99 |
20 |
- |
21 |
110 |
- |
110 |
28 |
- |
28 |
|
1-19 |
91 |
- |
101 |
19 |
- |
22 |
110 |
- |
110 |
28 |
- |
28 |
|
1-2 |
91 |
- |
97 |
18 |
- |
21 |
126 |
- |
126 |
29 |
- |
29 |
|
1-21 |
91 |
- |
100 |
18 |
- |
22 |
110 |
- |
110 |
28 |
- |
28 |
|
1-22 |
96 |
- |
104 |
20 |
- |
25 |
110 |
- |
110 |
28 |
- |
28 |
|
1-29 |
94 |
- |
100 |
21 |
- |
24 |
117 |
- |
117 |
26 |
- |
26 |
|
1-3 |
92 |
- |
98 |
19 |
- |
20 |
131 |
- |
131 |
29 |
- |
29 |
|
1-30 |
91 |
- |
98 |
21 |
- |
23 |
117 |
- |
117 |
26 |
- |
26 |
|
1-4 |
92 |
- |
97 |
18 |
- |
20 |
131 |
- |
131 |
29 |
- |
29 |
|
1-5 |
92 |
- |
100 |
18 |
- |
21 |
131 |
- |
131 |
29 |
- |
29 |
|
1-6 |
92 |
- |
100 |
18 |
- |
21 |
131 |
- |
131 |
29 |
- |
29 |
|
1-8 |
92 |
- |
99 |
18 |
- |
21 |
131 |
- |
131 |
29 |
- |
29 |
|
1-9 |
92 |
- |
101 |
18 |
- |
21 |
131 |
- |
131 |
29 |
- |
29 |
|
2-1 |
91 |
- |
93 |
18 |
- |
19 |
153 |
- |
153 |
30 |
- |
30 |
|
2-10 |
91 |
- |
94 |
18 |
- |
20 |
153 |
- |
153 |
30 |
- |
30 |
|
2-11 |
91 |
- |
97 |
18 |
- |
22 |
153 |
- |
153 |
30 |
- |
30 |
|
2-14 |
91 |
- |
94 |
18 |
- |
20 |
153 |
- |
153 |
30 |
- |
30 |
|
2-15 |
92 |
- |
93 |
18 |
- |
19 |
153 |
- |
153 |
30 |
- |
30 |
|
2-16 |
91 |
- |
92 |
18 |
- |
19 |
153 |
- |
153 |
30 |
- |
30 |
|
2-17 |
92 |
- |
93 |
18 |
- |
20 |
153 |
- |
153 |
30 |
- |
30 |
|
2-18 |
93 |
- |
97 |
19 |
- |
20 |
132 |
- |
153 |
30 |
- |
30 |
|
2-19 |
95 |
- |
96 |
20 |
- |
20 |
132 |
- |
132 |
30 |
- |
30 |
|
2-2 |
91 |
- |
93 |
18 |
- |
19 |
153 |
- |
153 |
30 |
- |
30 |
|
2-20 |
94 |
- |
95 |
19 |
- |
21 |
132 |
- |
132 |
30 |
- |
30 |
|
2-21 |
96 |
- |
100 |
19 |
- |
21 |
132 |
- |
132 |
30 |
- |
30 |
|
2-22 |
96 |
- |
98 |
19 |
- |
21 |
132 |
- |
132 |
30 |
- |
30 |
|
2-24 |
92 |
- |
98 |
19 |
- |
22 |
131 |
- |
132 |
29 |
- |
30 |
|
2-25 |
96 |
- |
98 |
19 |
- |
20 |
132 |
- |
132 |
30 |
- |
30 |
|
2-26 |
96 |
- |
99 |
19 |
- |
20 |
132 |
- |
132 |
30 |
- |
30 |
|
2-28 |
97 |
- |
100 |
19 |
- |
20 |
132 |
- |
132 |
30 |
- |
30 |
|
2-29 |
96 |
- |
101 |
19 |
- |
21 |
132 |
- |
132 |
30 |
- |
30 |
|
2-3 |
91 |
- |
92 |
18 |
- |
19 |
153 |
- |
153 |
30 |
- |
30 |
|
2-30 |
92 |
- |
102 |
18 |
- |
21 |
132 |
- |
132 |
30 |
- |
30 |
|
2-31 |
92 |
- |
98 |
18 |
- |
22 |
131 |
- |
132 |
29 |
- |
30 |
|
2-33 |
97 |
- |
107 |
19 |
- |
23 |
132 |
- |
132 |
30 |
- |
30 |
|
2-7 |
91 |
- |
93 |
18 |
- |
19 |
153 |
- |
153 |
30 |
- |
30 |
|
2-9 |
91 |
- |
93 |
18 |
- |
20 |
153 |
- |
153 |
30 |
- |
30 |
|
3-1 |
92 |
- |
98 |
18 |
- |
23 |
132 |
- |
132 |
30 |
- |
30 |
|
3-11 |
92 |
- |
104 |
19 |
- |
24 |
119 |
- |
131 |
30 |
- |
33 |
|
3-13 |
91 |
- |
101 |
18 |
- |
23 |
119 |
- |
132 |
30 |
- |
30 |
|
3-14 |
92 |
- |
103 |
19 |
- |
23 |
119 |
- |
119 |
30 |
- |
30 |
|
3-15 |
91 |
- |
101 |
18 |
- |
25 |
132 |
- |
132 |
30 |
- |
30 |
|
3-16 |
93 |
- |
106 |
19 |
- |
26 |
119 |
- |
119 |
30 |
- |
30 |
|
3-18 |
92 |
- |
111 |
19 |
- |
26 |
119 |
- |
119 |
30 |
- |
30 |
|
3-20 |
93 |
- |
109 |
19 |
- |
23 |
119 |
- |
119 |
30 |
- |
30 |
|
3-24 |
93 |
- |
119 |
19 |
- |
25 |
119 |
- |
119 |
30 |
- |
30 |
|
3-25 |
91 |
- |
106 |
19 |
- |
22 |
110 |
- |
119 |
28 |
- |
30 |
|
3-27 |
93 |
- |
112 |
19 |
- |
25 |
119 |
- |
119 |
30 |
- |
30 |
|
3-28 |
93 |
- |
109 |
19 |
- |
24 |
119 |
- |
119 |
30 |
- |
30 |
|
3-29 |
93 |
- |
107 |
19 |
- |
23 |
119 |
- |
134 |
29 |
- |
30 |
|
3-32 |
94 |
- |
108 |
19 |
- |
24 |
119 |
- |
134 |
29 |
- |
30 |
|
3-33 |
95 |
- |
105 |
20 |
- |
23 |
134 |
- |
134 |
29 |
- |
29 |
|
3-34 |
95 |
- |
100 |
21 |
- |
22 |
117 |
- |
134 |
26 |
- |
29 |
|
3-39 |
95 |
- |
109 |
20 |
- |
24 |
134 |
- |
134 |
29 |
- |
29 |
|
3-4 |
91 |
- |
102 |
18 |
- |
24 |
132 |
- |
132 |
30 |
- |
30 |
|
3-40 |
95 |
- |
105 |
20 |
- |
23 |
134 |
- |
134 |
29 |
- |
29 |
|
3-42 |
89 |
- |
103 |
19 |
- |
24 |
117 |
- |
134 |
26 |
- |
29 |
|
3-43 |
97 |
- |
125 |
21 |
- |
36 |
134 |
- |
134 |
29 |
- |
29 |
|
3-44 |
97 |
- |
111 |
21 |
- |
28 |
134 |
- |
134 |
29 |
- |
29 |
|
3-45 |
98 |
- |
125 |
21 |
- |
36 |
134 |
- |
134 |
29 |
- |
29 |
|
3-5 |
91 |
- |
98 |
18 |
- |
23 |
132 |
- |
132 |
30 |
- |
30 |
|
3-50 |
96 |
- |
134 |
21 |
- |
36 |
127 |
- |
134 |
28 |
- |
29 |
|
3-51 |
96 |
- |
140 |
21 |
- |
36 |
127 |
- |
127 |
28 |
- |
28 |
|
3-52 |
94 |
- |
145 |
21 |
- |
36 |
127 |
- |
127 |
28 |
- |
28 |
|
3-6 |
90 |
- |
100 |
18 |
- |
24 |
132 |
- |
132 |
30 |
- |
30 |
|
3-7 |
90 |
- |
98 |
18 |
- |
23 |
132 |
- |
170 |
30 |
- |
32 |
|
3-8 |
90 |
- |
103 |
18 |
- |
25 |
131 |
- |
170 |
30 |
- |
33 |
|
4-1 |
94 |
- |
115 |
19 |
- |
26 |
134 |
- |
134 |
29 |
- |
29 |
|
4-10 |
94 |
- |
101 |
19 |
- |
22 |
134 |
- |
134 |
29 |
- |
29 |
|
4-12a |
91 |
- |
127 |
19 |
- |
30 |
127 |
- |
127 |
28 |
- |
28 |
|
4-12b |
91 |
- |
118 |
19 |
- |
27 |
127 |
- |
127 |
28 |
- |
28 |
|
4-12c |
94 |
- |
107 |
19 |
- |
24 |
134 |
- |
134 |
29 |
- |
29 |
|
4-12d |
91 |
- |
106 |
19 |
- |
26 |
127 |
- |
127 |
28 |
- |
28 |
|
4-13a |
91 |
- |
109 |
19 |
- |
24 |
127 |
- |
127 |
28 |
- |
28 |
|
4-13b |
91 |
- |
103 |
19 |
- |
22 |
127 |
- |
134 |
28 |
- |
29 |
|
4-14 |
100 |
- |
103 |
22 |
- |
23 |
127 |
- |
134 |
28 |
- |
29 |
|
4-15 |
91 |
- |
114 |
20 |
- |
29 |
127 |
- |
127 |
28 |
- |
28 |
|
4-16 |
91 |
- |
104 |
19 |
- |
23 |
127 |
- |
127 |
28 |
- |
28 |
|
4-17 |
94 |
- |
129 |
21 |
- |
31 |
127 |
- |
127 |
28 |
- |
28 |
|
4-2 |
99 |
- |
116 |
21 |
- |
26 |
134 |
- |
134 |
29 |
- |
29 |
|
4-20 |
105 |
- |
115 |
24 |
- |
27 |
127 |
- |
127 |
28 |
- |
28 |
|
4-21 |
92 |
- |
126 |
21 |
- |
30 |
127 |
- |
127 |
28 |
- |
28 |
|
4-22 |
91 |
- |
110 |
19 |
- |
27 |
127 |
- |
127 |
28 |
- |
28 |
|
4-24 |
87 |
- |
99 |
18 |
- |
24 |
111 |
- |
111 |
26 |
- |
26 |
|
4-25a |
87 |
- |
101 |
18 |
- |
23 |
111 |
- |
127 |
26 |
- |
28 |
|
4-25b |
87 |
- |
98 |
18 |
- |
24 |
111 |
- |
117 |
26 |
- |
26 |
|
4-25c |
91 |
- |
101 |
19 |
- |
23 |
127 |
- |
134 |
28 |
- |
29 |
|
4-26 |
87 |
- |
99 |
18 |
- |
23 |
111 |
- |
111 |
26 |
- |
26 |
|
4-28 |
87 |
- |
108 |
18 |
- |
25 |
111 |
- |
127 |
26 |
- |
28 |
|
4-29 |
91 |
- |
105 |
19 |
- |
24 |
127 |
- |
127 |
28 |
- |
28 |
|
4-3 |
94 |
- |
103 |
19 |
- |
24 |
134 |
- |
134 |
29 |
- |
29 |
|
4-31 |
91 |
- |
107 |
19 |
- |
25 |
127 |
- |
127 |
28 |
- |
28 |
|
4-32 |
91 |
- |
107 |
19 |
- |
26 |
127 |
- |
127 |
28 |
- |
28 |
|
4-33 |
96 |
- |
112 |
21 |
- |
27 |
127 |
- |
127 |
28 |
- |
28 |
|
4-36 |
96 |
- |
105 |
21 |
- |
25 |
127 |
- |
127 |
28 |
- |
28 |
|
4-4 |
94 |
- |
111 |
19 |
- |
25 |
134 |
- |
134 |
29 |
- |
29 |
|
4-5 |
94 |
- |
110 |
19 |
- |
24 |
134 |
- |
134 |
29 |
- |
29 |
|
4-6 |
94 |
- |
101 |
19 |
- |
23 |
134 |
- |
134 |
29 |
- |
29 |
|
4-8 |
97 |
- |
101 |
21 |
- |
22 |
134 |
- |
134 |
29 |
- |
29 |
|
4-9 |
94 |
- |
101 |
19 |
- |
22 |
134 |
- |
134 |
29 |
- |
29 |
|
5-1 |
92 |
- |
103 |
20 |
- |
24 |
111 |
- |
111 |
27 |
- |
27 |
|
5-13 |
90 |
- |
108 |
19 |
- |
25 |
110 |
- |
118 |
26 |
- |
28 |
|
5-14 |
92 |
- |
104 |
21 |
- |
24 |
118 |
- |
118 |
26 |
- |
26 |
|
5-16 |
91 |
- |
102 |
18 |
- |
26 |
110 |
- |
110 |
28 |
- |
28 |
|
5-17 |
91 |
- |
98 |
18 |
- |
24 |
110 |
- |
110 |
28 |
- |
28 |
|
5-18a |
91 |
- |
98 |
18 |
- |
22 |
110 |
- |
110 |
28 |
- |
28 |
|
5-18b |
91 |
- |
99 |
18 |
- |
24 |
110 |
- |
110 |
28 |
- |
28 |
|
5-2 |
94 |
- |
103 |
21 |
- |
25 |
111 |
- |
111 |
27 |
- |
27 |
|
5-21 |
95 |
- |
98 |
20 |
- |
23 |
110 |
- |
110 |
28 |
- |
28 |
|
5-22 |
91 |
- |
99 |
20 |
- |
25 |
117 |
- |
117 |
26 |
- |
26 |
|
5-23 |
91 |
- |
98 |
20 |
- |
23 |
117 |
- |
117 |
26 |
- |
26 |
|
5-24 |
88 |
- |
98 |
18 |
- |
23 |
117 |
- |
117 |
26 |
- |
26 |
|
5-26 |
89 |
- |
99 |
19 |
- |
24 |
117 |
- |
117 |
26 |
- |
26 |
|
5-27 |
93 |
- |
99 |
21 |
- |
24 |
117 |
- |
117 |
26 |
- |
26 |
|
5-28 |
93 |
- |
99 |
21 |
- |
24 |
117 |
- |
117 |
26 |
- |
26 |
|
5-32 |
88 |
- |
105 |
18 |
- |
28 |
117 |
- |
117 |
26 |
- |
26 |
|
5-33 |
91 |
- |
99 |
20 |
- |
24 |
117 |
- |
117 |
26 |
- |
26 |
|
5-34 |
91 |
- |
96 |
20 |
- |
24 |
117 |
- |
117 |
26 |
- |
26 |
|
5-37 |
92 |
- |
99 |
20 |
- |
24 |
117 |
- |
117 |
26 |
- |
26 |
|
5-38 |
94 |
- |
104 |
21 |
- |
25 |
117 |
- |
117 |
26 |
- |
26 |
|
5-3a |
91 |
- |
102 |
18 |
- |
23 |
110 |
- |
111 |
27 |
- |
28 |
|
5-3b |
92 |
- |
101 |
20 |
- |
23 |
111 |
- |
111 |
27 |
- |
27 |
|
5-4 |
92 |
- |
102 |
20 |
- |
25 |
111 |
- |
111 |
27 |
- |
27 |
|
5-42 |
98 |
- |
107 |
22 |
- |
24 |
117 |
- |
117 |
26 |
- |
26 |
|
5-6 |
100 |
- |
103 |
22 |
- |
24 |
111 |
- |
111 |
27 |
- |
27 |
|
5-7a |
92 |
- |
102 |
20 |
- |
24 |
111 |
- |
111 |
27 |
- |
27 |
|
5-7b |
92 |
- |
101 |
20 |
- |
25 |
111 |
- |
111 |
27 |
- |
27 |
|
5-8 |
92 |
- |
102 |
20 |
- |
25 |
111 |
- |
111 |
27 |
- |
27 |
|
5-9 |
92 |
- |
102 |
20 |
- |
23 |
111 |
- |
111 |
27 |
- |
27 |
Note: Bolded and underlined figure represents exceedance of relevant
AQOs. The range of the results
means the predicted concentrations at the ASRs within the site at all
assessment heights.
Table 3.31 Predicted Operational Air Quality Impact on Representative Existing ASRs in Year 2031 – Year 2039
|
ASR
ID |
19th Highest Hourly NO2
Conc. (µg/m3) |
Annual NO2 Conc. (µg/m3) |
4th Highest 10-min SO2 Conc.
(µg/m3) |
4th Highest Daily SO2
Conc. (µg/m3) |
||||||||
|
A1001 |
97 |
- |
97 |
20 |
- |
20 |
132 |
- |
132 |
30 |
- |
30 |
|
A1002 |
97 |
- |
97 |
21 |
- |
21 |
132 |
- |
132 |
30 |
- |
30 |
|
A1003 |
95 |
- |
95 |
20 |
- |
20 |
132 |
- |
132 |
30 |
- |
30 |
|
A1004 |
95 |
- |
95 |
19 |
- |
19 |
132 |
- |
132 |
30 |
- |
30 |
|
A1005 |
95 |
- |
95 |
19 |
- |
20 |
132 |
- |
132 |
30 |
- |
30 |
|
A102 |
95 |
- |
111 |
21 |
- |
30 |
114 |
- |
114 |
26 |
- |
26 |
|
A103 |
98 |
- |
104 |
23 |
- |
27 |
114 |
- |
114 |
26 |
- |
26 |
|
A104 |
102 |
- |
103 |
25 |
- |
26 |
114 |
- |
114 |
26 |
- |
26 |
|
A105 |
101 |
- |
112 |
25 |
- |
28 |
114 |
- |
114 |
26 |
- |
26 |
|
A106 |
103 |
- |
105 |
26 |
- |
27 |
114 |
- |
114 |
26 |
- |
26 |
|
A107 |
104 |
- |
104 |
26 |
- |
26 |
114 |
- |
114 |
26 |
- |
26 |
|
A108 |
102 |
- |
102 |
25 |
- |
26 |
114 |
- |
114 |
26 |
- |
26 |
|
A109 |
98 |
- |
99 |
24 |
- |
24 |
114 |
- |
114 |
26 |
- |
26 |
|
A110 |
111 |
- |
112 |
26 |
- |
26 |
114 |
- |
114 |
26 |
- |
26 |
|
A1101 |
97 |
- |
97 |
21 |
- |
21 |
131 |
- |
131 |
29 |
- |
29 |
|
A1102 |
96 |
- |
96 |
20 |
- |
20 |
131 |
- |
131 |
29 |
- |
29 |
|
A1103 |
92 |
- |
97 |
18 |
- |
20 |
131 |
- |
131 |
29 |
- |
29 |
|
A1104 |
92 |
- |
97 |
18 |
- |
20 |
131 |
- |
131 |
29 |
- |
29 |
|
A1105 |
92 |
- |
97 |
18 |
- |
21 |
131 |
- |
131 |
29 |
- |
29 |
|
A1106 |
92 |
- |
97 |
18 |
- |
20 |
131 |
- |
131 |
29 |
- |
29 |
|
A1107 |
92 |
- |
97 |
18 |
- |
22 |
131 |
- |
131 |
29 |
- |
29 |
|
A1108 |
93 |
- |
96 |
19 |
- |
20 |
131 |
- |
131 |
29 |
- |
29 |
|
A1109 |
92 |
- |
104 |
18 |
- |
22 |
131 |
- |
131 |
29 |
- |
29 |
|
A111 |
105 |
- |
106 |
24 |
- |
24 |
114 |
- |
114 |
26 |
- |
26 |
|
A112 |
108 |
- |
108 |
25 |
- |
25 |
114 |
- |
114 |
26 |
- |
26 |
|
A1201 |
99 |
- |
108 |
20 |
- |
26 |
110 |
- |
110 |
27 |
- |
27 |
|
A1202 |
99 |
- |
105 |
20 |
- |
24 |
110 |
- |
110 |
27 |
- |
27 |
|
A1203 |
99 |
- |
115 |
20 |
- |
26 |
110 |
- |
110 |
27 |
- |
27 |
|
A1300 |
100 |
- |
100 |
20 |
- |
20 |
256 |
- |
256 |
36 |
- |
36 |
|
A1301 |
91 |
- |
91 |
19 |
- |
19 |
153 |
- |
153 |
30 |
- |
30 |
|
A1302 |
92 |
- |
92 |
19 |
- |
19 |
153 |
- |
153 |
30 |
- |
30 |
|
A1303 |
95 |
- |
96 |
20 |
- |
21 |
153 |
- |
153 |
30 |
- |
30 |
|
A1304 |
94 |
- |
97 |
19 |
- |
20 |
153 |
- |
153 |
30 |
- |
30 |
|
A1305 |
94 |
- |
98 |
19 |
- |
20 |
153 |
- |
153 |
30 |
- |
30 |
|
A1306 |
93 |
- |
95 |
19 |
- |
19 |
153 |
- |
153 |
30 |
- |
30 |
|
A1307 |
91 |
- |
92 |
19 |
- |
19 |
153 |
- |
153 |
30 |
- |
30 |
|
A1308 |
92 |
- |
93 |
19 |
- |
19 |
153 |
- |
153 |
30 |
- |
30 |
|
A1309 |
91 |
- |
92 |
18 |
- |
19 |
153 |
- |
153 |
30 |
- |
30 |
|
A1401 |
92 |
- |
92 |
19 |
- |
19 |
126 |
- |
126 |
29 |
- |
29 |
|
A1402 |
91 |
- |
95 |
18 |
- |
21 |
126 |
- |
126 |
29 |
- |
29 |
|
A1403 |
91 |
- |
95 |
18 |
- |
21 |
126 |
- |
126 |
29 |
- |
29 |
|
A1404 |
91 |
- |
97 |
17 |
- |
20 |
126 |
- |
126 |
29 |
- |
29 |
|
A1405 |
91 |
- |
97 |
17 |
- |
20 |
126 |
- |
126 |
29 |
- |
29 |
|
A1501 |
97 |
- |
97 |
22 |
- |
22 |
131 |
- |
131 |
33 |
- |
33 |
|
A201 |
103 |
- |
104 |
23 |
- |
23 |
127 |
- |
127 |
28 |
- |
28 |
|
A202 |
106 |
- |
106 |
24 |
- |
24 |
127 |
- |
127 |
28 |
- |
28 |
|
A203 |
107 |
- |
107 |
24 |
- |
25 |
127 |
- |
127 |
28 |
- |
28 |
|
A204 |
105 |
- |
109 |
24 |
- |
25 |
127 |
- |
127 |
28 |
- |
28 |
|
A205 |
104 |
- |
108 |
23 |
- |
24 |
127 |
- |
127 |
28 |
- |
28 |
|
A206 |
108 |
- |
110 |
30 |
- |
31 |
127 |
- |
127 |
28 |
- |
28 |
|
A207 |
97 |
- |
97 |
24 |
- |
24 |
127 |
- |
127 |
28 |
- |
28 |
|
A208 |
107 |
- |
109 |
28 |
- |
29 |
127 |
- |
127 |
28 |
- |
28 |
|
A209 |
104 |
- |
109 |
23 |
- |
26 |
127 |
- |
127 |
28 |
- |
28 |
|
A301 |
96 |
- |
96 |
22 |
- |
22 |
111 |
- |
111 |
26 |
- |
26 |
|
A302 |
95 |
- |
96 |
22 |
- |
22 |
111 |
- |
111 |
26 |
- |
26 |
|
A303 |
95 |
- |
97 |
22 |
- |
22 |
111 |
- |
111 |
26 |
- |
26 |
|
A304 |
96 |
- |
98 |
22 |
- |
22 |
111 |
- |
111 |
26 |
- |
26 |
|
A305 |
97 |
- |
97 |
22 |
- |
22 |
111 |
- |
111 |
26 |
- |
26 |
|
A306 |
95 |
- |
97 |
22 |
- |
22 |
111 |
- |
111 |
26 |
- |
26 |
|
A307 |
95 |
- |
96 |
22 |
- |
22 |
111 |
- |
111 |
26 |
- |
26 |
|
A308 |
96 |
- |
97 |
22 |
- |
22 |
111 |
- |
111 |
26 |
- |
26 |
|
A309 |
96 |
- |
97 |
22 |
- |
22 |
111 |
- |
111 |
26 |
- |
26 |
|
A310 |
100 |
- |
100 |
25 |
- |
25 |
111 |
- |
111 |
26 |
- |
26 |
|
A311 |
92 |
- |
99 |
21 |
- |
23 |
111 |
- |
111 |
26 |
- |
26 |
|
A312 |
98 |
- |
99 |
22 |
- |
23 |
111 |
- |
111 |
26 |
- |
26 |
|
A313 |
93 |
- |
103 |
21 |
- |
25 |
111 |
- |
111 |
26 |
- |
26 |
|
A314 |
93 |
- |
101 |
21 |
- |
25 |
111 |
- |
111 |
26 |
- |
26 |
|
A401 |
95 |
- |
98 |
21 |
- |
22 |
117 |
- |
117 |
26 |
- |
26 |
|
A402 |
97 |
- |
98 |
22 |
- |
24 |
117 |
- |
117 |
26 |
- |
26 |
|
A403 |
93 |
- |
99 |
20 |
- |
24 |
117 |
- |
117 |
26 |
- |
26 |
|
A404 |
97 |
- |
102 |
22 |
- |
24 |
117 |
- |
117 |
26 |
- |
26 |
|
A405 |
92 |
- |
100 |
21 |
- |
24 |
117 |
- |
117 |
26 |
- |
26 |
|
A406 |
97 |
- |
99 |
22 |
- |
25 |
117 |
- |
117 |
26 |
- |
26 |
|
A407 |
95 |
- |
97 |
22 |
- |
24 |
117 |
- |
117 |
26 |
- |
26 |
|
A408 |
96 |
- |
98 |
22 |
- |
22 |
117 |
- |
117 |
26 |
- |
26 |
|
A409 |
92 |
- |
100 |
20 |
- |
26 |
117 |
- |
117 |
26 |
- |
26 |
|
A410 |
97 |
- |
98 |
22 |
- |
24 |
117 |
- |
117 |
26 |
- |
26 |
|
A411 |
97 |
- |
98 |
22 |
- |
23 |
117 |
- |
117 |
26 |
- |
26 |
|
A412 |
95 |
- |
96 |
22 |
- |
24 |
117 |
- |
117 |
26 |
- |
26 |
|
A413 |
98 |
- |
98 |
23 |
- |
24 |
117 |
- |
117 |
26 |
- |
26 |
|
A414 |
96 |
- |
96 |
22 |
- |
22 |
117 |
- |
117 |
26 |
- |
26 |
|
A415 |
94 |
- |
95 |
22 |
- |
22 |
117 |
- |
117 |
26 |
- |
26 |
|
A416 |
92 |
- |
99 |
20 |
- |
24 |
117 |
- |
117 |
26 |
- |
26 |
|
A502 |
90 |
- |
103 |
21 |
- |
26 |
118 |
- |
118 |
26 |
- |
26 |
|
A503 |
98 |
- |
104 |
24 |
- |
26 |
118 |
- |
118 |
26 |
- |
26 |
|
A504 |
101 |
- |
101 |
23 |
- |
24 |
118 |
- |
118 |
26 |
- |
26 |
|
A505 |
99 |
- |
99 |
22 |
- |
23 |
118 |
- |
118 |
26 |
- |
26 |
|
A506 |
98 |
- |
99 |
23 |
- |
23 |
118 |
- |
118 |
26 |
- |
26 |
|
A507 |
98 |
- |
101 |
21 |
- |
24 |
118 |
- |
118 |
26 |
- |
26 |
|
A508 |
98 |
- |
102 |
22 |
- |
25 |
118 |
- |
118 |
26 |
- |
26 |
|
A601 |
99 |
- |
100 |
21 |
- |
21 |
119 |
- |
119 |
30 |
- |
30 |
|
A602 |
99 |
- |
99 |
24 |
- |
24 |
119 |
- |
119 |
30 |
- |
30 |
|
A603 |
99 |
- |
99 |
23 |
- |
23 |
119 |
- |
119 |
30 |
- |
30 |
|
A701 |
97 |
- |
98 |
22 |
- |
24 |
110 |
- |
110 |
28 |
- |
28 |
|
A702 |
98 |
- |
105 |
22 |
- |
23 |
110 |
- |
110 |
28 |
- |
28 |
|
A703 |
99 |
- |
100 |
22 |
- |
22 |
110 |
- |
110 |
28 |
- |
28 |
|
A704 |
97 |
- |
98 |
22 |
- |
22 |
110 |
- |
110 |
28 |
- |
28 |
|
A705 |
99 |
- |
99 |
22 |
- |
22 |
110 |
- |
110 |
28 |
- |
28 |
|
A706 |
97 |
- |
98 |
21 |
- |
21 |
110 |
- |
110 |
28 |
- |
28 |
|
A707 |
95 |
- |
97 |
19 |
- |
21 |
110 |
- |
110 |
28 |
- |
28 |
|
A708 |
97 |
- |
98 |
21 |
- |
21 |
110 |
- |
110 |
28 |
- |
28 |
|
A801 |
100 |
- |
100 |
22 |
- |
23 |
111 |
- |
111 |
27 |
- |
27 |
|
A802 |
99 |
- |
100 |
22 |
- |
22 |
111 |
- |
111 |
27 |
- |
27 |
|
A803 |
96 |
- |
99 |
22 |
- |
22 |
111 |
- |
111 |
27 |
- |
27 |
|
A804 |
98 |
- |
99 |
22 |
- |
23 |
111 |
- |
111 |
27 |
- |
27 |
|
A805 |
98 |
- |
102 |
22 |
- |
24 |
111 |
- |
111 |
27 |
- |
27 |
|
A806 |
97 |
- |
98 |
21 |
- |
21 |
111 |
- |
111 |
27 |
- |
27 |
|
A807 |
99 |
- |
100 |
21 |
- |
21 |
111 |
- |
111 |
27 |
- |
27 |
|
A808 |
95 |
- |
108 |
21 |
- |
26 |
111 |
- |
111 |
27 |
- |
27 |
|
A809 |
95 |
- |
102 |
21 |
- |
23 |
111 |
- |
111 |
27 |
- |
27 |
|
A810 |
95 |
- |
101 |
21 |
- |
22 |
111 |
- |
111 |
27 |
- |
27 |
|
A811 |
94 |
- |
104 |
21 |
- |
25 |
111 |
- |
111 |
27 |
- |
27 |
|
A812 |
92 |
- |
102 |
20 |
- |
24 |
111 |
- |
111 |
27 |
- |
27 |
|
A813 |
92 |
- |
101 |
20 |
- |
23 |
111 |
- |
111 |
27 |
- |
27 |
|
A901 |
96 |
- |
96 |
21 |
- |
21 |
170 |
- |
170 |
32 |
- |
32 |
|
A902 |
96 |
- |
96 |
20 |
- |
20 |
170 |
- |
170 |
32 |
- |
32 |
|
A903 |
96 |
- |
96 |
20 |
- |
20 |
170 |
- |
170 |
32 |
- |
32 |
Note: Bolded and underlined figure represents exceedance of relevant
AQOs. The range of the results
means the predicted concentrations at the ASRs within the site at all
assessment heights.
Table 3.32 Predicted Operational Air Quality Impact (Particulates) on Sites with Air Sensitive Use in Year 2031 – Year 2039
|
Site |
10th Highest Daily RSP
Conc. (µg/m3) |
Annual RSP Conc. (µg/m3) |
10th Highest Daily FSP Conc. (µg/m3) |
Annual FSP Conc. (µg/m3) |
||||||||
|
1-1 |
91 |
- |
92 |
40 |
- |
41 |
69 |
- |
69 |
29 |
- |
29 |
|
1-12 |
92 |
- |
92 |
41 |
- |
41 |
69 |
- |
69 |
29 |
- |
29 |
|
1-13 |
92 |
- |
92 |
41 |
- |
41 |
69 |
- |
69 |
29 |
- |
29 |
|
1-15 |
92 |
- |
92 |
41 |
- |
41 |
69 |
- |
69 |
29 |
- |
29 |
|
1-16 |
92 |
- |
92 |
41 |
- |
41 |
69 |
- |
69 |
29 |
- |
29 |
|
1-17 |
92 |
- |
92 |
41 |
- |
41 |
69 |
- |
69 |
29 |
- |
29 |
|
1-18 |
92 |
- |
92 |
41 |
- |
41 |
69 |
- |
69 |
29 |
- |
29 |
|
1-19 |
92 |
- |
92 |
41 |
- |
41 |
69 |
- |
69 |
29 |
- |
29 |
|
1-2 |
91 |
- |
91 |
40 |
- |
41 |
68 |
- |
69 |
29 |
- |
29 |
|
1-21 |
92 |
- |
92 |
41 |
- |
41 |
69 |
- |
69 |
29 |
- |
29 |
|
1-22 |
92 |
- |
92 |
41 |
- |
41 |
69 |
- |
69 |
29 |
- |
29 |
|
1-29 |
92 |
- |
92 |
41 |
- |
41 |
69 |
- |
69 |
29 |
- |
29 |
|
1-3 |
92 |
- |
92 |
41 |
- |
41 |
69 |
- |
69 |
29 |
- |
29 |
|
1-30 |
92 |
- |
92 |
41 |
- |
41 |
69 |
- |
69 |
29 |
- |
29 |
|
1-4 |
92 |
- |
92 |
41 |
- |
41 |
69 |
- |
69 |
29 |
- |
29 |
|
1-5 |
92 |
- |
92 |
41 |
- |
41 |
69 |
- |
69 |
29 |
- |
29 |
|
1-6 |
92 |
- |
92 |
41 |
- |
41 |
69 |
- |
69 |
29 |
- |
29 |
|
1-8 |
92 |
- |
92 |
41 |
- |
41 |
69 |
- |
69 |
29 |
- |
29 |
|
1-9 |
92 |
- |
92 |
41 |
- |
41 |
69 |
- |
69 |
29 |
- |
29 |
|
2-1 |
92 |
- |
92 |
41 |
- |
41 |
69 |
- |
69 |
29 |
- |
29 |
|
2-10 |
92 |
- |
92 |
41 |
- |
41 |
69 |
- |
69 |
29 |
- |
29 |
|
2-11 |
92 |
- |
92 |
41 |
- |
41 |
69 |
- |
69 |
29 |
- |
29 |
|
2-14 |
92 |
- |
92 |
41 |
- |
41 |
69 |
- |
69 |
29 |
- |
29 |
|
2-15 |
92 |
- |
92 |
41 |
- |
41 |
69 |
- |
69 |
29 |
- |
29 |
|
2-16 |
92 |
- |
92 |
41 |
- |
41 |
69 |
- |
69 |
29 |
- |
29 |
|
2-17 |
92 |
- |
92 |
41 |
- |
41 |
69 |
- |
69 |
29 |
- |
29 |
|
2-18 |
92 |
- |
94 |
41 |
- |
42 |
69 |
- |
71 |
29 |
- |
30 |
|
2-19 |
94 |
- |
94 |
42 |
- |
42 |
71 |
- |
71 |
30 |
- |
30 |
|
2-2 |
92 |
- |
92 |
41 |
- |
41 |
69 |
- |
69 |
29 |
- |
29 |
|
2-20 |
94 |
- |
94 |
42 |
- |
42 |
71 |
- |
71 |
30 |
- |
30 |
|
2-21 |
94 |
- |
94 |
42 |
- |
42 |
71 |
- |
71 |
30 |
- |
30 |
|
2-22 |
94 |
- |
94 |
42 |
- |
42 |
71 |
- |
71 |
30 |
- |
30 |
|
2-24 |
92 |
- |
94 |
41 |
- |
42 |
69 |
- |
71 |
29 |
- |
30 |
|
2-25 |
94 |
- |
94 |
42 |
- |
42 |
71 |
- |
71 |
30 |
- |
30 |
|
2-26 |
94 |
- |
94 |
42 |
- |
42 |
71 |
- |
71 |
30 |
- |
30 |
|
2-28 |
94 |
- |
94 |
42 |
- |
42 |
71 |
- |
71 |
30 |
- |
30 |
|
2-29 |
94 |
- |
94 |
42 |
- |
42 |
71 |
- |
71 |
30 |
- |
30 |
|
2-3 |
92 |
- |
92 |
41 |
- |
41 |
69 |
- |
69 |
29 |
- |
29 |
|
2-30 |
94 |
- |
94 |
42 |
- |
42 |
71 |
- |
71 |
29 |
- |
30 |
|
2-31 |
92 |
- |
94 |
41 |
- |
42 |
69 |
- |
71 |
29 |
- |
30 |
|
2-33 |
94 |
- |
94 |
42 |
- |
42 |
71 |
- |
71 |
30 |
- |
30 |
|
2-7 |
92 |
- |
92 |
41 |
- |
41 |
69 |
- |
69 |
29 |
- |
29 |
|
2-9 |
92 |
- |
92 |
41 |
- |
41 |
69 |
- |
69 |
29 |
- |
29 |
|
3-1 |
94 |
- |
94 |
42 |
- |
42 |
71 |
- |
71 |
29 |
- |
30 |
|
3-11 |
94 |
- |
97 |
41 |
- |
43 |
70 |
- |
73 |
29 |
- |
30 |
|
3-13 |
94 |
- |
94 |
41 |
- |
42 |
70 |
- |
71 |
29 |
- |
30 |
|
3-14 |
94 |
- |
94 |
41 |
- |
42 |
70 |
- |
70 |
29 |
- |
30 |
|
3-15 |
94 |
- |
94 |
42 |
- |
42 |
71 |
- |
71 |
29 |
- |
30 |
|
3-16 |
94 |
- |
94 |
41 |
- |
42 |
70 |
- |
71 |
29 |
- |
30 |
|
3-18 |
94 |
- |
94 |
41 |
- |
42 |
70 |
- |
70 |
29 |
- |
30 |
|
3-20 |
94 |
- |
94 |
41 |
- |
41 |
70 |
- |
70 |
29 |
- |
29 |
|
3-24 |
94 |
- |
94 |
41 |
- |
42 |
70 |
- |
70 |
29 |
- |
30 |
|
3-25 |
92 |
- |
94 |
41 |
- |
41 |
69 |
- |
70 |
29 |
- |
29 |
|
3-27 |
94 |
- |
94 |
41 |
- |
42 |
70 |
- |
70 |
29 |
- |
30 |
|
3-28 |
94 |
- |
94 |
41 |
- |
41 |
70 |
- |
70 |
29 |
- |
29 |
|
3-29 |
94 |
- |
94 |
41 |
- |
42 |
70 |
- |
70 |
29 |
- |
30 |
|
3-32 |
94 |
- |
94 |
41 |
- |
42 |
70 |
- |
70 |
29 |
- |
30 |
|
3-33 |
94 |
- |
94 |
42 |
- |
42 |
70 |
- |
70 |
30 |
- |
30 |
|
3-34 |
92 |
- |
94 |
41 |
- |
42 |
69 |
- |
70 |
29 |
- |
30 |
|
3-39 |
94 |
- |
94 |
42 |
- |
42 |
70 |
- |
70 |
30 |
- |
30 |
|
3-4 |
94 |
- |
94 |
42 |
- |
42 |
71 |
- |
71 |
29 |
- |
30 |
|
3-40 |
94 |
- |
94 |
42 |
- |
42 |
70 |
- |
70 |
30 |
- |
30 |
|
3-42 |
92 |
- |
94 |
41 |
- |
42 |
69 |
- |
70 |
29 |
- |
30 |
|
3-43 |
94 |
- |
95 |
42 |
- |
43 |
70 |
- |
71 |
30 |
- |
30 |
|
3-44 |
94 |
- |
98 |
42 |
- |
43 |
70 |
- |
71 |
30 |
- |
30 |
|
3-45 |
94 |
- |
97 |
42 |
- |
43 |
70 |
- |
71 |
30 |
- |
30 |
|
3-5 |
94 |
- |
94 |
42 |
- |
42 |
71 |
- |
71 |
29 |
- |
30 |
|
3-50 |
93 |
- |
95 |
42 |
- |
43 |
70 |
- |
71 |
30 |
- |
30 |
|
3-51 |
93 |
- |
93 |
42 |
- |
42 |
70 |
- |
70 |
30 |
- |
30 |
|
3-52 |
93 |
- |
94 |
42 |
- |
43 |
70 |
- |
71 |
30 |
- |
31 |
|
3-6 |
94 |
- |
94 |
42 |
- |
42 |
71 |
- |
71 |
29 |
- |
30 |
|
3-7 |
94 |
- |
95 |
42 |
- |
42 |
71 |
- |
72 |
29 |
- |
30 |
|
3-8 |
94 |
- |
97 |
42 |
- |
43 |
71 |
- |
73 |
29 |
- |
30 |
|
4-1 |
94 |
- |
94 |
42 |
- |
42 |
70 |
- |
70 |
30 |
- |
30 |
|
4-10 |
94 |
- |
94 |
42 |
- |
42 |
70 |
- |
70 |
30 |
- |
30 |
|
4-12a |
93 |
- |
93 |
42 |
- |
42 |
70 |
- |
70 |
30 |
- |
30 |
|
4-12b |
93 |
- |
93 |
42 |
- |
42 |
70 |
- |
70 |
30 |
- |
30 |
|
4-12c |
94 |
- |
94 |
42 |
- |
42 |
70 |
- |
70 |
30 |
- |
30 |
|
4-12d |
93 |
- |
93 |
42 |
- |
42 |
70 |
- |
70 |
30 |
- |
30 |
|
4-13a |
93 |
- |
93 |
42 |
- |
42 |
70 |
- |
70 |
30 |
- |
30 |
|
4-13b |
93 |
- |
94 |
42 |
- |
42 |
70 |
- |
70 |
30 |
- |
30 |
|
4-14 |
93 |
- |
94 |
42 |
- |
42 |
70 |
- |
70 |
30 |
- |
30 |
|
4-15 |
93 |
- |
93 |
42 |
- |
42 |
70 |
- |
70 |
30 |
- |
30 |
|
4-16 |
93 |
- |
93 |
42 |
- |
42 |
70 |
- |
70 |
30 |
- |
30 |
|
4-17 |
93 |
- |
93 |
42 |
- |
42 |
70 |
- |
70 |
30 |
- |
30 |
|
4-2 |
94 |
- |
95 |
42 |
- |
42 |
70 |
- |
70 |
30 |
- |
30 |
|
4-20 |
93 |
- |
93 |
42 |
- |
42 |
70 |
- |
70 |
30 |
- |
30 |
|
4-21 |
93 |
- |
93 |
42 |
- |
42 |
70 |
- |
70 |
30 |
- |
30 |
|
4-22 |
93 |
- |
93 |
42 |
- |
42 |
70 |
- |
70 |
30 |
- |
30 |
|
4-24 |
93 |
- |
93 |
42 |
- |
42 |
70 |
- |
70 |
30 |
- |
30 |
|
4-25a |
93 |
- |
93 |
42 |
- |
42 |
70 |
- |
70 |
30 |
- |
30 |
|
4-25b |
92 |
- |
93 |
41 |
- |
42 |
69 |
- |
70 |
29 |
- |
30 |
|
4-25c |
93 |
- |
94 |
42 |
- |
42 |
70 |
- |
70 |
30 |
- |
30 |
|
4-26 |
93 |
- |
93 |
42 |
- |
42 |
70 |
- |
70 |
30 |
- |
30 |
|
4-28 |
93 |
- |
93 |
42 |
- |
42 |
70 |
- |
70 |
30 |
- |
30 |
|
4-29 |
93 |
- |
93 |
42 |
- |
42 |
70 |
- |
70 |
30 |
- |
30 |
|
4-3 |
94 |
- |
94 |
42 |
- |
42 |
70 |
- |
70 |
30 |
- |
30 |
|
4-31 |
93 |
- |
93 |
42 |
- |
42 |
70 |
- |
70 |
30 |
- |
30 |
|
4-32 |
93 |
- |
93 |
42 |
- |
42 |
70 |
- |
70 |
30 |
- |
30 |
|
4-33 |
93 |
- |
93 |
42 |
- |
42 |
70 |
- |
70 |
30 |
- |
30 |
|
4-36 |
93 |
- |
93 |
42 |
- |
42 |
70 |
- |
70 |
30 |
- |
30 |
|
4-4 |
94 |
- |
94 |
42 |
- |
42 |
70 |
- |
70 |
30 |
- |
30 |
|
4-5 |
94 |
- |
94 |
42 |
- |
42 |
70 |
- |
70 |
30 |
- |
30 |
|
4-6 |
94 |
- |
94 |
42 |
- |
42 |
70 |
- |
70 |
30 |
- |
30 |
|
4-8 |
94 |
- |
94 |
42 |
- |
42 |
70 |
- |
70 |
30 |
- |
30 |
|
4-9 |
94 |
- |
94 |
42 |
- |
42 |
70 |
- |
70 |
30 |
- |
30 |
|
5-1 |
92 |
- |
92 |
41 |
- |
41 |
69 |
- |
69 |
29 |
- |
29 |
|
5-13 |
92 |
- |
92 |
41 |
- |
41 |
69 |
- |
69 |
29 |
- |
29 |
|
5-14 |
92 |
- |
93 |
41 |
- |
41 |
69 |
- |
69 |
29 |
- |
29 |
|
5-16 |
92 |
- |
92 |
41 |
- |
41 |
69 |
- |
69 |
29 |
- |
29 |
|
5-17 |
92 |
- |
92 |
41 |
- |
41 |
69 |
- |
69 |
29 |
- |
29 |
|
5-18a |
92 |
- |
92 |
41 |
- |
41 |
69 |
- |
69 |
29 |
- |
29 |
|
5-18b |
92 |
- |
92 |
41 |
- |
41 |
69 |
- |
69 |
29 |
- |
29 |
|
5-2 |
92 |
- |
92 |
41 |
- |
41 |
69 |
- |
69 |
29 |
- |
29 |
|
5-21 |
92 |
- |
92 |
41 |
- |
41 |
69 |
- |
69 |
29 |
- |
29 |
|
5-22 |
92 |
- |
92 |
41 |
- |
41 |
69 |
- |
69 |
29 |
- |
29 |
|
5-23 |
92 |
- |
92 |
41 |
- |
41 |
69 |
- |
69 |
29 |
- |
29 |
|
5-24 |
92 |
- |
92 |
41 |
- |
41 |
69 |
- |
69 |
29 |
- |
29 |
|
5-26 |
92 |
- |
92 |
41 |
- |
41 |
69 |
- |
69 |
29 |
- |
29 |
|
5-27 |
92 |
- |
92 |
41 |
- |
41 |
69 |
- |
69 |
29 |
- |
29 |
|
5-28 |
92 |
- |
92 |
41 |
- |
41 |
69 |
- |
69 |
29 |
- |
29 |
|
5-32 |
92 |
- |
92 |
41 |
- |
41 |
69 |
- |
69 |
29 |
- |
29 |
|
5-33 |
92 |
- |
92 |
41 |
- |
41 |
69 |
- |
69 |
29 |
- |
29 |
|
5-34 |
92 |
- |
92 |
41 |
- |
41 |
69 |
- |
69 |
29 |
- |
29 |
|
5-37 |
92 |
- |
92 |
41 |
- |
41 |
69 |
- |
69 |
29 |
- |
29 |
|
5-38 |
92 |
- |
92 |
41 |
- |
41 |
69 |
- |
69 |
29 |
- |
29 |
|
5-3a |
92 |
- |
92 |
41 |
- |
41 |
69 |
- |
69 |
29 |
- |
29 |
|
5-3b |
92 |
- |
92 |
41 |
- |
41 |
69 |
- |
69 |
29 |
- |
29 |
|
5-4 |
92 |
- |
92 |
41 |
- |
41 |
69 |
- |
69 |
29 |
- |
29 |
|
5-42 |
92 |
- |
92 |
41 |
- |
41 |
69 |
- |
69 |
29 |
- |
29 |
|
5-6 |
92 |
- |
92 |
41 |
- |
41 |
69 |
- |
69 |
29 |
- |
29 |
|
5-7a |
92 |
- |
92 |
41 |
- |
41 |
69 |
- |
69 |
29 |
- |
29 |
|
5-7b |
92 |
- |
92 |
41 |
- |
41 |
69 |
- |
69 |
29 |
- |
29 |
|
5-8 |
92 |
- |
92 |
41 |
- |
41 |
69 |
- |
69 |
29 |
- |
29 |
|
5-9 |
92 |
- |
92 |
41 |
- |
41 |
69 |
- |
69 |
29 |
- |
29 |
Note: Bolded and underlined figure represents exceedance of relevant
AQOs. The range of the results
means the predicted concentrations at the ASRs within the site at all
assessment heights.
Table 3.33 Predicted Operational Air Quality Impact (Particulates) on Representative Existing ASRs in Year 2031 – Year 2039
|
ASR
ID |
10th Highest Daily RSP
Conc. (µg/m3) |
Annual RSP Conc. (µg/m3) |
10th Highest Daily FSP Conc. (µg/m3) |
Annual FSP Conc. (µg/m3) |
||||||||
|
A1001 |
94 |
- |
94 |
42 |
- |
42 |
71 |
- |
71 |
30 |
- |
30 |
|
A1002 |
94 |
- |
94 |
42 |
- |
42 |
71 |
- |
71 |
30 |
- |
30 |
|
A1003 |
94 |
- |
94 |
42 |
- |
42 |
71 |
- |
71 |
30 |
- |
30 |
|
A1004 |
94 |
- |
94 |
42 |
- |
42 |
71 |
- |
71 |
30 |
- |
30 |
|
A1005 |
94 |
- |
94 |
42 |
- |
42 |
71 |
- |
71 |
30 |
- |
30 |
|
A102 |
93 |
- |
93 |
42 |
- |
43 |
70 |
- |
70 |
30 |
- |
30 |
|
A103 |
93 |
- |
93 |
42 |
- |
42 |
70 |
- |
70 |
30 |
- |
30 |
|
A104 |
93 |
- |
93 |
42 |
- |
42 |
70 |
- |
70 |
30 |
- |
30 |
|
A105 |
93 |
- |
93 |
42 |
- |
42 |
70 |
- |
70 |
30 |
- |
30 |
|
A106 |
93 |
- |
93 |
42 |
- |
42 |
70 |
- |
70 |
30 |
- |
30 |
|
A107 |
93 |
- |
93 |
42 |
- |
42 |
70 |
- |
70 |
30 |
- |
30 |
|
A108 |
93 |
- |
93 |
42 |
- |
42 |
70 |
- |
70 |
30 |
- |
30 |
|
A109 |
93 |
- |
93 |
42 |
- |
42 |
70 |
- |
70 |
30 |
- |
30 |
|
A110 |
93 |
- |
93 |
42 |
- |
42 |
70 |
- |
70 |
30 |
- |
30 |
|
A1101 |
92 |
- |
92 |
41 |
- |
41 |
69 |
- |
69 |
29 |
- |
29 |
|
A1102 |
92 |
- |
92 |
41 |
- |
41 |
69 |
- |
69 |
29 |
- |
29 |
|
A1103 |
92 |
- |
92 |
41 |
- |
41 |
69 |
- |
69 |
29 |
- |
29 |
|
A1104 |
92 |
- |
92 |
41 |
- |
41 |
69 |
- |
69 |
29 |
- |
29 |
|
A1105 |
92 |
- |
92 |
41 |
- |
41 |
69 |
- |
69 |
29 |
- |
29 |
|
A1106 |
92 |
- |
92 |
41 |
- |
41 |
69 |
- |
69 |
29 |
- |
29 |
|
A1107 |
92 |
- |
92 |
41 |
- |
41 |
69 |
- |
69 |
29 |
- |
29 |
|
A1108 |
92 |
- |
92 |
41 |
- |
41 |
69 |
- |
69 |
29 |
- |
29 |
|
A1109 |
92 |
- |
92 |
41 |
- |
41 |
69 |
- |
69 |
29 |
- |
29 |
|
A111 |
93 |
- |
93 |
42 |
- |
42 |
70 |
- |
70 |
30 |
- |
30 |
|
A112 |
93 |
- |
93 |
42 |
- |
42 |
70 |
- |
70 |
30 |
- |
30 |
|
A1201 |
92 |
- |
92 |
40 |
- |
41 |
69 |
- |
69 |
29 |
- |
29 |
|
A1202 |
92 |
- |
92 |
40 |
- |
41 |
69 |
- |
69 |
29 |
- |
29 |
|
A1203 |
92 |
- |
92 |
40 |
- |
41 |
69 |
- |
69 |
29 |
- |
29 |
|
A1300 |
93 |
- |
93 |
41 |
- |
41 |
70 |
- |
70 |
29 |
- |
29 |
|
A1301 |
92 |
- |
92 |
41 |
- |
41 |
69 |
- |
69 |
29 |
- |
29 |
|
A1302 |
92 |
- |
92 |
41 |
- |
41 |
69 |
- |
69 |
29 |
- |
29 |
|
A1303 |
92 |
- |
92 |
41 |
- |
41 |
69 |
- |
69 |
29 |
- |
29 |
|
A1304 |
92 |
- |
92 |
41 |
- |
41 |
69 |
- |
69 |
29 |
- |
29 |
|
A1305 |
92 |
- |
92 |
41 |
- |
41 |
69 |
- |
69 |
29 |
- |
29 |
|
A1306 |
92 |
- |
92 |
41 |
- |
41 |
69 |
- |
69 |
29 |
- |
29 |
|
A1307 |
92 |
- |
92 |
41 |
- |
41 |
69 |
- |
69 |
29 |
- |
29 |
|
A1308 |
92 |
- |
92 |
41 |
- |
41 |
69 |
- |
69 |
29 |
- |
29 |
|
A1309 |
92 |
- |
92 |
41 |
- |
41 |
69 |
- |
69 |
29 |
- |
29 |
|
A1401 |
91 |
- |
91 |
40 |
- |
40 |
69 |
- |
69 |
29 |
- |
29 |
|
A1402 |
91 |
- |
92 |
40 |
- |
41 |
68 |
- |
69 |
29 |
- |
29 |
|
A1403 |
91 |
- |
91 |
40 |
- |
41 |
68 |
- |
69 |
29 |
- |
29 |
|
A1404 |
91 |
- |
91 |
40 |
- |
41 |
68 |
- |
69 |
29 |
- |
29 |
|
A1405 |
91 |
- |
91 |
40 |
- |
41 |
68 |
- |
69 |
29 |
- |
29 |
|
A1501 |
97 |
- |
97 |
43 |
- |
43 |
73 |
- |
73 |
30 |
- |
30 |
|
A201 |
93 |
- |
93 |
42 |
- |
42 |
70 |
- |
70 |
30 |
- |
30 |
|
A202 |
93 |
- |
93 |
42 |
- |
42 |
70 |
- |
70 |
30 |
- |
30 |
|
A203 |
93 |
- |
93 |
42 |
- |
42 |
70 |
- |
70 |
30 |
- |
30 |
|
A204 |
93 |
- |
93 |
42 |
- |
42 |
70 |
- |
70 |
30 |
- |
30 |
|
A205 |
93 |
- |
93 |
42 |
- |
42 |
70 |
- |
70 |
30 |
- |
30 |
|
A206 |
93 |
- |
93 |
42 |
- |
42 |
70 |
- |
70 |
30 |
- |
30 |
|
A207 |
93 |
- |
93 |
42 |
- |
42 |
70 |
- |
70 |
30 |
- |
30 |
|
A208 |
93 |
- |
93 |
42 |
- |
42 |
70 |
- |
70 |
30 |
- |
30 |
|
A209 |
93 |
- |
93 |
42 |
- |
42 |
70 |
- |
70 |
30 |
- |
30 |
|
A301 |
93 |
- |
93 |
42 |
- |
42 |
70 |
- |
70 |
30 |
- |
30 |
|
A302 |
93 |
- |
93 |
42 |
- |
42 |
70 |
- |
70 |
30 |
- |
30 |
|
A303 |
93 |
- |
93 |
42 |
- |
42 |
70 |
- |
70 |
30 |
- |
30 |
|
A304 |
93 |
- |
93 |
42 |
- |
42 |
70 |
- |
70 |
30 |
- |
30 |
|
A305 |
93 |
- |
93 |
42 |
- |
42 |
70 |
- |
70 |
30 |
- |
30 |
|
A306 |
93 |
- |
93 |
42 |
- |
42 |
70 |
- |
70 |
30 |
- |
30 |
|
A307 |
93 |
- |
93 |
42 |
- |
42 |
70 |
- |
70 |
30 |
- |
30 |
|
A308 |
93 |
- |
93 |
42 |
- |
42 |
70 |
- |
70 |
30 |
- |
30 |
|
A309 |
93 |
- |
93 |
42 |
- |
42 |
70 |
- |
70 |
30 |
- |
30 |
|
A310 |
93 |
- |
93 |
42 |
- |
42 |
70 |
- |
70 |
30 |
- |
30 |
|
A311 |
93 |
- |
93 |
42 |
- |
42 |
70 |
- |
70 |
30 |
- |
30 |
|
A312 |
93 |
- |
93 |
42 |
- |
42 |
70 |
- |
70 |
30 |
- |
30 |
|
A313 |
93 |
- |
93 |
42 |
- |
42 |
70 |
- |
70 |
30 |
- |
30 |
|
A314 |
93 |
- |
93 |
42 |
- |
42 |
70 |
- |
70 |
30 |
- |
30 |
|
A401 |
92 |
- |
92 |
41 |
- |
41 |
69 |
- |
69 |
29 |
- |
29 |
|
A402 |
92 |
- |
92 |
41 |
- |
41 |
69 |
- |
69 |
29 |
- |
29 |
|
A403 |
92 |
- |
92 |
41 |
- |
41 |
69 |
- |
69 |
29 |
- |
29 |
|
A404 |
92 |
- |
92 |
41 |
- |
41 |
69 |
- |
69 |
29 |
- |
29 |
|
A405 |
92 |
- |
92 |
41 |
- |
41 |
69 |
- |
69 |
29 |
- |
29 |
|
A406 |
92 |
- |
92 |
41 |
- |
41 |
69 |
- |
69 |
29 |
- |
29 |
|
A407 |
92 |
- |
92 |
41 |
- |
41 |
69 |
- |
69 |
29 |
- |
29 |
|
A408 |
92 |
- |
92 |
41 |
- |
41 |
69 |
- |
69 |
29 |
- |
29 |
|
A409 |
92 |
- |
92 |
41 |
- |
41 |
69 |
- |
69 |
29 |
- |
29 |
|
A410 |
92 |
- |
92 |
41 |
- |
41 |
69 |
- |
69 |
29 |
- |
29 |
|
A411 |
92 |
- |
92 |
41 |
- |
41 |
69 |
- |
69 |
29 |
- |
29 |
|
A412 |
92 |
- |
92 |
41 |
- |
41 |
69 |
- |
69 |
29 |
- |
29 |
|
A413 |
92 |
- |
92 |
41 |
- |
41 |
69 |
- |
69 |
29 |
- |
29 |
|
A414 |
92 |
- |
92 |
41 |
- |
41 |
69 |
- |
69 |
29 |
- |
29 |
|
A415 |
92 |
- |
92 |
41 |
- |
41 |
69 |
- |
69 |
29 |
- |
29 |
|
A416 |
92 |
- |
92 |
41 |
- |
41 |
69 |
- |
69 |
29 |
- |
29 |
|
A502 |
92 |
- |
93 |
41 |
- |
41 |
69 |
- |
69 |
29 |
- |
29 |
|
A503 |
93 |
- |
93 |
41 |
- |
42 |
69 |
- |
69 |
29 |
- |
29 |
|
A504 |
92 |
- |
92 |
42 |
- |
42 |
69 |
- |
69 |
29 |
- |
29 |
|
A505 |
92 |
- |
92 |
41 |
- |
41 |
69 |
- |
69 |
29 |
- |
29 |
|
A506 |
92 |
- |
92 |
41 |
- |
41 |
69 |
- |
69 |
29 |
- |
29 |
|
A507 |
92 |
- |
92 |
41 |
- |
41 |
69 |
- |
69 |
29 |
- |
29 |
|
A508 |
92 |
- |
92 |
41 |
- |
41 |
69 |
- |
69 |
29 |
- |
29 |
|
A601 |
94 |
- |
94 |
41 |
- |
41 |
70 |
- |
70 |
29 |
- |
29 |
|
A602 |
94 |
- |
94 |
42 |
- |
42 |
71 |
- |
71 |
30 |
- |
30 |
|
A603 |
94 |
- |
94 |
42 |
- |
42 |
71 |
- |
71 |
30 |
- |
30 |
|
A701 |
92 |
- |
92 |
41 |
- |
41 |
69 |
- |
69 |
29 |
- |
29 |
|
A702 |
92 |
- |
92 |
41 |
- |
41 |
69 |
- |
69 |
29 |
- |
29 |
|
A703 |
92 |
- |
92 |
41 |
- |
41 |
69 |
- |
69 |
29 |
- |
29 |
|
A704 |
92 |
- |
92 |
41 |
- |
41 |
69 |
- |
69 |
29 |
- |
29 |
|
A705 |
92 |
- |
92 |
41 |
- |
41 |
69 |
- |
69 |
29 |
- |
29 |
|
A706 |
92 |
- |
92 |
41 |
- |
41 |
69 |
- |
69 |
29 |
- |
29 |
|
A707 |
92 |
- |
92 |
41 |
- |
41 |
69 |
- |
69 |
29 |
- |
29 |
|
A708 |
92 |
- |
92 |
41 |
- |
41 |
69 |
- |
69 |
29 |
- |
29 |
|
A801 |
92 |
- |
92 |
41 |
- |
41 |
69 |
- |
69 |
29 |
- |
29 |
|
A802 |
92 |
- |
92 |
41 |
- |
41 |
69 |
- |
69 |
29 |
- |
29 |
|
A803 |
92 |
- |
92 |
41 |
- |
41 |
69 |
- |
69 |
29 |
- |
29 |
|
A804 |
92 |
- |
92 |
41 |
- |
41 |
69 |
- |
69 |
29 |
- |
29 |
|
A805 |
92 |
- |
92 |
41 |
- |
41 |
69 |
- |
69 |
29 |
- |
29 |
|
A806 |
92 |
- |
92 |
41 |
- |
41 |
69 |
- |
69 |
29 |
- |
29 |
|
A807 |
92 |
- |
92 |
41 |
- |
41 |
69 |
- |
69 |
29 |
- |
29 |
|
A808 |
92 |
- |
92 |
41 |
- |
41 |
69 |
- |
69 |
29 |
- |
29 |
|
A809 |
92 |
- |
92 |
41 |
- |
41 |
69 |
- |
69 |
29 |
- |
29 |
|
A810 |
92 |
- |
92 |
41 |
- |
41 |
69 |
- |
69 |
29 |
- |
29 |
|
A811 |
92 |
- |
92 |
41 |
- |
41 |
69 |
- |
69 |
29 |
- |
29 |
|
A812 |
92 |
- |
92 |
41 |
- |
41 |
69 |
- |
69 |
29 |
- |
29 |
|
A813 |
92 |
- |
92 |
41 |
- |
41 |
69 |
- |
69 |
29 |
- |
29 |
|
A901 |
95 |
- |
95 |
42 |
- |
42 |
71 |
- |
72 |
30 |
- |
30 |
|
A902 |
95 |
- |
95 |
42 |
- |
42 |
71 |
- |
71 |
30 |
- |
30 |
|
A903 |
95 |
- |
95 |
42 |
- |
42 |
71 |
- |
71 |
30 |
- |
30 |
Note: Bolded and underlined figure represents exceedance of relevant
AQOs. The range of the results means
the predicted concentrations at the ASRs within the site at all assessment
heights.
3.9.6 According to the assessment results, the worst-hit generally appears at 1.5 meters above ground (mAG) of the receptors. As NO2 and particulates are considered the potential key air pollutant associated with the operation of the Project, the contour plots for NO2, RSP and FSP are presented. The contour plot of 19th highest hourly average and annual average NO2 concentrations at 1.5 mAG are illustrated in Figure 3.12 and Figure 3.13. The contour plot of 10th highest daily average and annual average RSP concentrations at 1.5 mAG are illustrated in Figure 3.16 and Figure 3.17. The contour plot of 10th highest daily average and annual average FSP concentrations at 1.5 mAG are illustrated in Figure 3.18 and Figure 3.19.
Predicted Odour Impact by Existing Chicken Farm
3.9.7 The odour concentrations due to the subject chicken farm at the nearest planned development sites are predicted and presented in Table 3.34. A contour plot of odour concentration covering 500 m area from chicken farm boundary at 1.5 mAG is presented in Figure 3.20. According to the spatial plot of odour concentration, it is noted that exceedance of 5 odour units would be predicted at portion of Site 3-1 (OU, PBU + SWU) at 1.5 mAG and 5 mAG. It is proposed that air sensitive uses at Site 3-1 should not be located at this exceedance zone or the fresh air intake of the building located at 6 mAG or above. The detailed assessment results are presented in Appendix 3.15.
Table 3.34 Predicted Cumulative Odour Concentration (OU/m3) due to Existing Chicken Farm
|
Site / ASR ID |
Maximum 5-second Odour Concentration
(OU/m3) |
||
|
2-18 |
0.3 |
- |
0.7 |
|
2-19 |
0.3 |
- |
0.7 |
|
2-20 |
0.2 |
- |
1.3 |
|
2-21 |
0.0 |
- |
0.9 |
|
2-22 |
0.1 |
- |
0.6 |
|
2-24 |
0.0 |
- |
0.5 |
|
2-25 |
0.1 |
- |
0.6 |
|
2-26 |
0.0 |
- |
0.9 |
|
2-28 |
0.0 |
- |
1.1 |
|
2-29 |
0.0 |
- |
1.5 |
|
2-30 |
0.0 |
- |
0.9 |
|
2-31 |
0.0 |
- |
0.6 |
|
2-33 |
0.0 |
- |
1.4 |
|
3-1 |
0.0 |
- |
7.8 |
|
3-13 |
0.0 |
- |
0.5 |
|
3-15 |
0.0 |
- |
1.0 |
|
3-4 |
0.0 |
- |
2.0 |
|
3-5 |
0.1 |
- |
1.3 |
|
3-6 |
0.0 |
- |
0.7 |
|
3-7 |
0.1 |
- |
0.6 |
|
3-8 |
0.0 |
- |
0.4 |
|
A1001 |
0.1 |
- |
0.5 |
|
A1002 |
0.6 |
- |
1.0 |
|
A1003 |
0.4 |
- |
0.8 |
|
A1004 |
0.3 |
- |
0.6 |
|
A1005 |
0.3 |
- |
0.7 |
Note: The range of the results means the predicted
concentrations at the ASRs within the site at all assessment heights.
For Site 3-1, exceedance of 5 odour units would be
predicted at 1.5 mAG and 5 mAG, no exceedance is predicted at 6 mAG, detailed
results refer to Appendix 3.15.
Predicted Cumulative Odour Impact from Upgraded San Wai STW, New HSK STW and planned RTS
3.9.8 The predicted cumulative odour concentrations due to the operation of expanded and upgraded San Wai STW, new HSK STW and planned RTS at the nearest ASRs are summarised in Table 3.35. Results indicate that no exceedance would be predicted at the nearest ASRs. Contour plots of odour concentration covering 500 m area from these facilities boundary at 1.5 mAG are presented in Figure 3.21. A 50 x 50 m grid is used to generate the pollution contours in order to investigate the pollutant dispersion. The detailed assessment results are presented in Appendix 3.16.
Table 3.35 Predicted Cumulative Odour Concentration (OU/m3) due to STWs and RTS
|
Site
/ ASR ID |
Maximum
5-second Odour Concentration (OU/m3) |
||
|
2-18 |
0.1 |
- |
0.1 |
|
2-19 |
0.1 |
- |
0.1 |
|
2-20 |
0.1 |
- |
0.1 |
|
2-21 |
0.1 |
- |
0.1 |
|
2-22 |
0.1 |
- |
0.1 |
|
2-24 |
0.1 |
- |
0.1 |
|
2-25 |
0.1 |
- |
0.1 |
|
2-26 |
0.1 |
- |
0.1 |
|
2-28 |
0.1 |
- |
0.1 |
|
2-29 |
0.1 |
- |
0.1 |
|
2-30 |
0.1 |
- |
0.2 |
|
2-31 |
0.1 |
- |
0.1 |
|
2-33 |
0.1 |
- |
0.2 |
|
3-1 |
0.1 |
- |
0.1 |
|
3-11 |
0.2 |
- |
1.3 |
|
3-13 |
0.1 |
- |
0.3 |
|
3-14 |
0.1 |
- |
0.4 |
|
3-15 |
0.1 |
- |
0.4 |
|
3-16 |
0.1 |
- |
0.3 |
|
3-18 |
0.1 |
- |
0.7 |
|
3-20 |
0.1 |
- |
0.4 |
|
3-24 |
0.1 |
- |
0.3 |
|
3-25 |
0.1 |
- |
0.3 |
|
3-27 |
0.1 |
- |
0.5 |
|
3-28 |
0.1 |
- |
0.4 |
|
3-29 |
0.1 |
- |
0.4 |
|
3-32 |
0.2 |
- |
0.6 |
|
3-4 |
0.1 |
- |
0.1 |
|
3-5 |
0.1 |
- |
0.2 |
|
3-6 |
0.1 |
- |
0.2 |
|
3-7 |
0.1 |
- |
0.2 |
|
3-8 |
0.1 |
- |
1.2 |
|
A1001 |
0.1 |
- |
0.1 |
|
A1002 |
0.1 |
- |
0.1 |
|
A1003 |
0.1 |
- |
0.1 |
|
A1004 |
0.1 |
- |
0.1 |
|
A1005 |
0.1 |
- |
0.1 |
|
A1501 |
0.9 |
- |
0.9 |
|
A601 |
0.3 |
- |
0.3 |
|
A602 |
1.5 |
- |
1.5 |
|
A603 |
1.1 |
- |
1.1 |
|
A901 |
0.4 |
- |
0.4 |
|
A902 |
0.1 |
- |
0.1 |
|
A903 |
0.1 |
- |
0.1 |
Note: The range of the results means the predicted
concentrations at the ASRs within the site at all assessment heights.
Potential Odour Impact from Sewage Pumping Stations
3.9.9 The four new SPS (DP9) would be constructed at Sites 2-34, 3-41, 3-48 and 4-35 to convey the sewage to San Wai STW and the new HSK STW. The design capacity of the SPS at Site 2-34 (SPS1), Site 3-41 (SPS2), Site 3-48 (SPS3) and Site 4-35 (SPS4) would be 27,000 m per day, 39,500 m3 per day, 11,000 m3 per day and 68,000 m3 per day, respectively. The separation distance between the nearest ASRs and the SPSs would be 76 m for SPS1, 93 m for SPS2, 100 m for SPS3 and 10 m for SPS4.
3.9.10 Potential odour emission from wet well, inlet chamber and screen chamber are possible odour sources of the SPSs. All facilities and areas with potential odour emission such as wet wells, inlet chamber and screen chambers would be covered by reinforced concrete structure and the exhausted air would be conveyed to a deodouriser with odour removal efficiency of at least 90% (e.g. 90% of odour removal efficiency of deodouriser (granular activated carbon) for the SPS as stated in Approved EIA Report for Tuen Mun Area 54 Sewage Pumping Station) for treatment before discharge to the environment. The ventilation system would also maintain a slight negative pressure within the facilities. In addition, the exhaust outlet of the deodouriser would be located away from the nearby ASRs as far as practicable. Similar odour mitigation measures have also been implemented at other SPSs in urban area to successfully control the potential odour impacts. The screening wastes would be removed regularly (i.e. at least twice a week) from the SPSs, and would be properly packed and handled within the SPS structures and transported to designated landfill for disposal immediately after collection from the SPSs. With proper implementation of these odour mitigation measures, adverse odour impact from SPS would not be expected.
3.10 Mitigation of Adverse Environmental Impacts
Construction Phase
3.10.1 In order to minimise the construction dust impact, the following dust mitigation measures shall be implemented:
· Watering once per hour on active works areas, exposed areas and unpaved haul roads to reduce dust emission by 91.7%. Any potential dust impact and watering mitigation would be subject to the actual site condition. For example, a construction activity that produces inherently wet conditions or in cases under rainy weather, the above water application intensity may not be unreservedly applied. While the above watering frequency is to be followed, the extent of watering may vary depending on actual site conditions but should be sufficient to achieve the removal efficiency. The dust levels would be monitored and managed under an EM&A programme as specified in the EM&A Manual.
Year 2026 – Year 2030 Scenario
Tier 1 Assessment
3.10.2 With the implementation of the above measures, the predicted cumulative maximum hourly average TSP, 10th highest daily and annual average RSP and FSP concentrations at the representative ASRs are summarised in Table 3.36 and Table 3.37. It is noted that the annual average RSP and FSP concentrations at the representative ASRs would comply with the AQOs. However, exceedance of hourly average TSP, 10th highest daily average RSP and FSP would still be predicted at some ASRs which are located in proximity to the work sites. Tier 2 assessment is required for these ASRs. The detailed prediction results are presented in Appendix 3.11. The contour plots of cumulative maximum hourly average TSP, 10th highest daily and annual average RSP and FSP concentrations at 1.5 mAG are presented in Figure 3.22, Figure 3.23, Figure 3.24, Figure 3.25, and Figure 3.26 respectively.
Table 3.36 Predicted Construction Dust Impact on Project Sites with Air Sensitive Use in Year 2019 – Year 2030 (Mitigated, Tier 1)
|
Site |
Maximum Hourly TSP Conc. (µg/m3) |
10th Highest Daily RSP
Conc. (µg/m3) |
Annual RSP Conc. (µg/m3) |
10th Highest Daily FSP
Conc. (µg/m3) |
Annual FSP Conc. (µg/m3) |
||||||||||
|
2-18 |
348 |
- |
544 |
95 |
- |
98 |
41 |
- |
42 |
69 |
- |
71 |
29 |
- |
30 |
|
2-19 |
366 |
- |
409 |
96 |
- |
97 |
42 |
- |
42 |
71 |
- |
71 |
30 |
- |
30 |
|
3-6 |
174 |
- |
1523 |
94 |
- |
120 |
42 |
- |
43 |
71 |
- |
72 |
30 |
- |
30 |
|
3-7 |
174 |
- |
729 |
94 |
- |
112 |
42 |
- |
43 |
71 |
- |
72 |
30 |
- |
30 |
|
3-8 |
174 |
- |
863 |
94 |
- |
111 |
42 |
- |
43 |
71 |
- |
75 |
30 |
- |
30 |
|
4-20 |
1153 |
- |
2111 |
117 |
- |
156 |
43 |
- |
45 |
75 |
- |
81 |
30 |
- |
30 |
|
5-2 |
176 |
- |
591 |
92 |
- |
98 |
41 |
- |
41 |
69 |
- |
70 |
29 |
- |
29 |
|
5-22 |
173 |
- |
476 |
92 |
- |
101 |
41 |
- |
42 |
69 |
- |
70 |
29 |
- |
29 |
|
5-23 |
173 |
- |
426 |
92 |
- |
99 |
41 |
- |
42 |
69 |
- |
70 |
29 |
- |
29 |
|
5-24 |
173 |
- |
829 |
92 |
- |
113 |
41 |
- |
42 |
69 |
- |
72 |
29 |
- |
30 |
|
5-26 |
173 |
- |
694 |
92 |
- |
112 |
41 |
- |
42 |
69 |
- |
72 |
29 |
- |
30 |
|
5-33 |
173 |
- |
408 |
92 |
- |
96 |
41 |
- |
42 |
69 |
- |
70 |
29 |
- |
29 |
|
5-6 |
213 |
- |
427 |
92 |
- |
93 |
41 |
- |
41 |
69 |
- |
69 |
29 |
- |
29 |
Note: Bolded and underlined figure represents exceedance of relevant
limits stipulated in EIAO-TM and AQOs. The range of the results means the
predicted concentrations at the ASRs within the site at all assessment heights.
Table 3.37 Predicted Construction Dust Impact on Representative Existing ASRs in Year 2019 – Year 2030 (Mitigated, Tier 1)
|
ASR
ID |
Maximum Hourly TSP Conc. (µg/m3) |
19th Highest Daily RSP
Conc. (µg/m3) |
Annual RSP Conc. (µg/m3) |
19th Highest Daily FSP
Conc. (µg/m3) |
Annual FSP Conc. (µg/m3) |
||||||||||
|
A1001 |
314 |
- |
319 |
100 |
- |
100 |
42 |
- |
42 |
71 |
- |
71 |
30 |
- |
30 |
|
A1002 |
525 |
- |
681 |
101 |
- |
103 |
42 |
- |
42 |
71 |
- |
71 |
30 |
- |
30 |
|
A1003 |
381 |
- |
393 |
97 |
- |
97 |
42 |
- |
42 |
71 |
- |
71 |
30 |
- |
30 |
|
A1004 |
403 |
- |
422 |
100 |
- |
100 |
42 |
- |
42 |
71 |
- |
71 |
30 |
- |
30 |
|
A1005 |
346 |
- |
368 |
97 |
- |
98 |
42 |
- |
42 |
71 |
- |
71 |
30 |
- |
30 |
|
A102 |
180 |
- |
726 |
94 |
- |
98 |
42 |
- |
43 |
70 |
- |
71 |
30 |
- |
30 |
|
A103 |
180 |
- |
634 |
94 |
- |
95 |
42 |
- |
43 |
70 |
- |
70 |
30 |
- |
30 |
|
A104 |
638 |
- |
659 |
96 |
- |
96 |
43 |
- |
43 |
70 |
- |
70 |
30 |
- |
30 |
|
A105 |
600 |
- |
655 |
96 |
- |
97 |
43 |
- |
43 |
71 |
- |
71 |
30 |
- |
30 |
|
A106 |
664 |
- |
688 |
98 |
- |
98 |
43 |
- |
43 |
71 |
- |
71 |
30 |
- |
30 |
|
A107 |
806 |
- |
841 |
104 |
- |
105 |
43 |
- |
43 |
71 |
- |
71 |
30 |
- |
30 |
|
A108 |
860 |
- |
897 |
107 |
- |
108 |
43 |
- |
43 |
72 |
- |
72 |
30 |
- |
30 |
|
A109 |
809 |
- |
826 |
109 |
- |
109 |
43 |
- |
43 |
72 |
- |
72 |
30 |
- |
30 |
|
A110 |
497 |
- |
593 |
94 |
- |
94 |
43 |
- |
43 |
70 |
- |
70 |
30 |
- |
30 |
|
A1101 |
292 |
- |
294 |
96 |
- |
96 |
41 |
- |
41 |
70 |
- |
70 |
29 |
- |
29 |
|
A1102 |
280 |
- |
286 |
95 |
- |
96 |
41 |
- |
41 |
70 |
- |
70 |
29 |
- |
29 |
|
A1103 |
172 |
- |
246 |
92 |
- |
93 |
41 |
- |
41 |
69 |
- |
69 |
29 |
- |
29 |
|
A1104 |
172 |
- |
222 |
92 |
- |
93 |
41 |
- |
41 |
69 |
- |
69 |
29 |
- |
29 |
|
A1105 |
172 |
- |
228 |
92 |
- |
93 |
41 |
- |
41 |
69 |
- |
69 |
29 |
- |
29 |
|
A1106 |
172 |
- |
256 |
92 |
- |
94 |
41 |
- |
41 |
69 |
- |
70 |
29 |
- |
29 |
|
A1107 |
172 |
- |
226 |
92 |
- |
94 |
41 |
- |
41 |
69 |
- |
69 |
29 |
- |
29 |
|
A1108 |
218 |
- |
241 |
93 |
- |
94 |
41 |
- |
41 |
69 |
- |
70 |
29 |
- |
29 |
|
A1109 |
172 |
- |
195 |
92 |
- |
93 |
41 |
- |
41 |
69 |
- |
69 |
29 |
- |
29 |
|
A111 |
710 |
- |
834 |
95 |
- |
96 |
43 |
- |
43 |
70 |
- |
70 |
30 |
- |
30 |
|
A112 |
670 |
- |
767 |
97 |
- |
98 |
43 |
- |
43 |
70 |
- |
70 |
30 |
- |
30 |
|
A1201 |
173 |
- |
173 |
92 |
- |
92 |
41 |
- |
41 |
69 |
- |
69 |
29 |
- |
29 |
|
A1202 |
173 |
- |
173 |
92 |
- |
92 |
41 |
- |
41 |
69 |
- |
69 |
29 |
- |
29 |
|
A1203 |
173 |
- |
173 |
92 |
- |
92 |
41 |
- |
41 |
69 |
- |
69 |
29 |
- |
29 |
|
A1300 |
598 |
- |
1144 |
103 |
- |
117 |
42 |
- |
42 |
72 |
- |
77 |
29 |
- |
30 |
|
A1301 |
284 |
- |
288 |
94 |
- |
94 |
41 |
- |
41 |
69 |
- |
69 |
29 |
- |
29 |
|
A1302 |
433 |
- |
446 |
94 |
- |
94 |
41 |
- |
41 |
69 |
- |
69 |
29 |
- |
29 |
|
A1303 |
280 |
- |
288 |
94 |
- |
94 |
41 |
- |
41 |
69 |
- |
69 |
29 |
- |
29 |
|
A1304 |
268 |
- |
276 |
94 |
- |
94 |
41 |
- |
41 |
69 |
- |
69 |
29 |
- |
29 |
|
A1305 |
309 |
- |
328 |
94 |
- |
94 |
41 |
- |
41 |
69 |
- |
69 |
29 |
- |
29 |
|
A1306 |
363 |
- |
369 |
94 |
- |
94 |
41 |
- |
41 |
69 |
- |
69 |
29 |
- |
29 |
|
A1307 |
392 |
- |
415 |
93 |
- |
93 |
41 |
- |
41 |
69 |
- |
69 |
29 |
- |
29 |
|
A1308 |
384 |
- |
392 |
93 |
- |
93 |
41 |
- |
41 |
69 |
- |
69 |
29 |
- |
29 |
|
A1309 |
319 |
- |
376 |
93 |
- |
93 |
41 |
- |
41 |
69 |
- |
69 |
29 |
- |
29 |
|
A1401 |
170 |
- |
170 |
92 |
- |
92 |
41 |
- |
41 |
69 |
- |
69 |
29 |
- |
29 |
|
A1402 |
170 |
- |
170 |
91 |
- |
92 |
40 |
- |
41 |
68 |
- |
69 |
29 |
- |
29 |
|
A1403 |
170 |
- |
170 |
91 |
- |
92 |
40 |
- |
41 |
68 |
- |
69 |
29 |
- |
29 |
|
A1404 |
170 |
- |
170 |
91 |
- |
92 |
40 |
- |
41 |
68 |
- |
69 |
29 |
- |
29 |
|
A1405 |
170 |
- |
170 |
91 |
- |
92 |
40 |
- |
41 |
68 |
- |
69 |
29 |
- |
29 |
|
A1501 |
583 |
- |
583 |
105 |
- |
105 |
43 |
- |
43 |
73 |
- |
73 |
30 |
- |
30 |
|
A201 |
816 |
- |
955 |
100 |
- |
101 |
42 |
- |
42 |
72 |
- |
72 |
30 |
- |
30 |
|
A202 |
988 |
- |
1286 |
103 |
- |
105 |
42 |
- |
43 |
72 |
- |
72 |
30 |
- |
30 |
|
A203 |
997 |
- |
1344 |
103 |
- |
106 |
42 |
- |
43 |
72 |
- |
73 |
30 |
- |
30 |
|
A204 |
954 |
- |
1439 |
105 |
- |
109 |
43 |
- |
43 |
73 |
- |
73 |
30 |
- |
30 |
|
A205 |
863 |
- |
1388 |
104 |
- |
110 |
43 |
- |
43 |
73 |
- |
73 |
30 |
- |
30 |
|
A206 |
1092 |
- |
1338 |
122 |
- |
124 |
43 |
- |
44 |
77 |
- |
77 |
30 |
- |
30 |
|
A207 |
1067 |
- |
1164 |
116 |
- |
117 |
43 |
- |
43 |
75 |
- |
75 |
30 |
- |
30 |
|
A208 |
1109 |
- |
1611 |
122 |
- |
133 |
43 |
- |
44 |
76 |
- |
78 |
30 |
- |
30 |
|
A209 |
988 |
- |
1739 |
112 |
- |
138 |
43 |
- |
44 |
75 |
- |
78 |
30 |
- |
30 |
|
A301 |
631 |
- |
783 |
98 |
- |
98 |
42 |
- |
42 |
71 |
- |
71 |
30 |
- |
30 |
|
A302 |
624 |
- |
784 |
98 |
- |
98 |
42 |
- |
43 |
71 |
- |
71 |
30 |
- |
30 |
|
A303 |
661 |
- |
830 |
98 |
- |
99 |
42 |
- |
43 |
70 |
- |
71 |
30 |
- |
30 |
|
A304 |
876 |
- |
1282 |
105 |
- |
114 |
43 |
- |
43 |
71 |
- |
72 |
30 |
- |
30 |
|
A305 |
535 |
- |
693 |
96 |
- |
98 |
42 |
- |
42 |
70 |
- |
70 |
30 |
- |
30 |
|
A306 |
771 |
- |
1334 |
107 |
- |
114 |
43 |
- |
43 |
72 |
- |
73 |
30 |
- |
30 |
|
A307 |
300 |
- |
590 |
96 |
- |
98 |
42 |
- |
42 |
70 |
- |
71 |
30 |
- |
30 |
|
A308 |
474 |
- |
644 |
97 |
- |
98 |
42 |
- |
43 |
71 |
- |
71 |
30 |
- |
30 |
|
A309 |
565 |
- |
724 |
98 |
- |
99 |
42 |
- |
43 |
71 |
- |
71 |
30 |
- |
30 |
|
A310 |
2126 |
|
2126 |
152 |
|
152 |
45 |
|
45 |
78 |
|
78 |
31 |
|
31 |
|
A311 |
411 |
- |
1270 |
98 |
- |
108 |
42 |
- |
43 |
71 |
- |
73 |
30 |
- |
30 |
|
A312 |
636 |
- |
766 |
100 |
- |
100 |
43 |
- |
43 |
71 |
- |
72 |
30 |
- |
30 |
|
A313 |
438 |
- |
1040 |
98 |
- |
104 |
42 |
- |
43 |
71 |
- |
73 |
30 |
- |
30 |
|
A314 |
401 |
- |
1566 |
98 |
- |
117 |
42 |
- |
43 |
71 |
- |
73 |
30 |
- |
30 |
|
A401 |
351 |
- |
459 |
94 |
- |
95 |
41 |
- |
41 |
69 |
- |
69 |
29 |
- |
29 |
|
A402 |
376 |
- |
387 |
94 |
- |
95 |
41 |
- |
41 |
69 |
- |
69 |
29 |
- |
29 |
|
A403 |
174 |
- |
343 |
93 |
- |
93 |
41 |
- |
41 |
69 |
- |
69 |
29 |
- |
29 |
|
A404 |
269 |
- |
282 |
93 |
- |
93 |
41 |
- |
41 |
69 |
- |
69 |
29 |
- |
29 |
|
A405 |
173 |
- |
253 |
93 |
- |
94 |
41 |
- |
41 |
69 |
- |
69 |
29 |
- |
29 |
|
A406 |
378 |
- |
380 |
97 |
- |
97 |
41 |
- |
42 |
69 |
- |
70 |
29 |
- |
30 |
|
A407 |
343 |
- |
368 |
96 |
- |
96 |
41 |
- |
42 |
70 |
- |
70 |
29 |
- |
29 |
|
A408 |
418 |
- |
420 |
96 |
- |
96 |
41 |
- |
41 |
69 |
- |
69 |
29 |
- |
29 |
|
A409 |
173 |
- |
272 |
92 |
- |
94 |
41 |
- |
42 |
69 |
- |
70 |
29 |
- |
30 |
|
A410 |
570 |
- |
571 |
95 |
- |
95 |
41 |
- |
41 |
69 |
- |
69 |
29 |
- |
29 |
|
A411 |
275 |
- |
275 |
93 |
- |
94 |
41 |
- |
41 |
69 |
- |
69 |
29 |
- |
29 |
|
A412 |
431 |
- |
434 |
94 |
- |
94 |
41 |
- |
41 |
69 |
- |
69 |
29 |
- |
29 |
|
A413 |
241 |
- |
246 |
93 |
- |
93 |
41 |
- |
42 |
69 |
- |
69 |
29 |
- |
30 |
|
A414 |
268 |
- |
274 |
93 |
- |
93 |
41 |
- |
41 |
69 |
- |
69 |
29 |
- |
29 |
|
A415 |
639 |
- |
646 |
104 |
- |
105 |
42 |
- |
42 |
71 |
- |
71 |
29 |
- |
29 |
|
A416 |
173 |
- |
510 |
93 |
- |
97 |
41 |
- |
42 |
69 |
- |
70 |
29 |
- |
29 |
|
A502 |
181 |
- |
952 |
93 |
- |
100 |
41 |
- |
42 |
69 |
- |
71 |
29 |
- |
30 |
|
A503 |
303 |
- |
515 |
94 |
- |
98 |
42 |
- |
42 |
70 |
- |
71 |
30 |
- |
30 |
|
A504 |
316 |
- |
316 |
94 |
- |
94 |
42 |
- |
42 |
69 |
- |
69 |
30 |
- |
30 |
|
A505 |
283 |
- |
287 |
93 |
- |
93 |
42 |
- |
42 |
69 |
- |
69 |
29 |
- |
29 |
|
A506 |
369 |
- |
372 |
93 |
- |
93 |
42 |
- |
42 |
70 |
- |
70 |
29 |
- |
29 |
|
A507 |
269 |
- |
290 |
92 |
- |
93 |
41 |
- |
42 |
69 |
- |
69 |
29 |
- |
30 |
|
A508 |
268 |
- |
279 |
93 |
- |
93 |
41 |
- |
42 |
69 |
- |
69 |
29 |
- |
30 |
|
A601 |
375 |
- |
385 |
102 |
- |
102 |
42 |
- |
42 |
71 |
- |
71 |
30 |
- |
30 |
|
A602 |
1154 |
- |
1154 |
120 |
- |
120 |
43 |
- |
43 |
75 |
- |
75 |
30 |
- |
30 |
|
A603 |
619 |
- |
619 |
106 |
- |
106 |
42 |
- |
42 |
72 |
- |
72 |
30 |
- |
30 |
|
A701 |
591 |
- |
615 |
102 |
- |
102 |
41 |
- |
41 |
70 |
- |
70 |
29 |
- |
29 |
|
A702 |
561 |
- |
584 |
101 |
- |
101 |
41 |
- |
41 |
70 |
- |
70 |
29 |
- |
29 |
|
A703 |
341 |
- |
456 |
103 |
- |
104 |
41 |
- |
42 |
70 |
- |
71 |
29 |
- |
29 |
|
A704 |
378 |
- |
382 |
101 |
- |
101 |
41 |
- |
41 |
70 |
- |
70 |
29 |
- |
29 |
|
A705 |
386 |
- |
393 |
98 |
- |
98 |
41 |
- |
41 |
70 |
- |
70 |
29 |
- |
29 |
|
A706 |
387 |
- |
398 |
97 |
- |
97 |
41 |
- |
41 |
70 |
- |
70 |
29 |
- |
29 |
|
A707 |
186 |
- |
338 |
92 |
- |
98 |
41 |
- |
41 |
69 |
- |
69 |
29 |
- |
29 |
|
A708 |
473 |
- |
488 |
98 |
- |
99 |
41 |
- |
41 |
70 |
- |
70 |
29 |
- |
29 |
|
A801 |
213 |
- |
215 |
93 |
- |
93 |
41 |
- |
41 |
69 |
- |
69 |
29 |
- |
29 |
|
A802 |
255 |
- |
283 |
92 |
- |
92 |
41 |
- |
41 |
69 |
- |
69 |
29 |
- |
29 |
|
A803 |
208 |
- |
249 |
92 |
- |
92 |
41 |
- |
41 |
69 |
- |
69 |
29 |
- |
29 |
|
A804 |
203 |
- |
219 |
92 |
- |
92 |
41 |
- |
41 |
69 |
- |
69 |
29 |
- |
29 |
|
A805 |
194 |
- |
205 |
92 |
- |
92 |
41 |
- |
41 |
69 |
- |
69 |
29 |
- |
29 |
|
A806 |
176 |
- |
176 |
92 |
- |
92 |
41 |
- |
41 |
69 |
- |
69 |
29 |
- |
29 |
|
A807 |
206 |
- |
210 |
92 |
- |
92 |
41 |
- |
41 |
69 |
- |
69 |
29 |
- |
29 |
|
A808 |
176 |
- |
327 |
92 |
- |
93 |
41 |
- |
41 |
69 |
- |
69 |
29 |
- |
29 |
|
A809 |
176 |
- |
239 |
92 |
- |
92 |
41 |
- |
41 |
69 |
- |
69 |
29 |
- |
29 |
|
A810 |
176 |
- |
226 |
92 |
- |
92 |
41 |
- |
41 |
69 |
- |
69 |
29 |
- |
29 |
|
A811 |
176 |
- |
212 |
92 |
- |
92 |
41 |
- |
41 |
69 |
- |
69 |
29 |
- |
29 |
|
A812 |
176 |
- |
247 |
92 |
- |
92 |
41 |
- |
41 |
69 |
- |
69 |
29 |
- |
29 |
|
A813 |
176 |
- |
317 |
92 |
- |
93 |
41 |
- |
41 |
69 |
- |
69 |
29 |
- |
29 |
|
A901 |
208 |
- |
214 |
97 |
- |
97 |
42 |
- |
42 |
72 |
- |
72 |
30 |
- |
30 |
|
A902 |
326 |
- |
331 |
99 |
- |
99 |
42 |
- |
42 |
72 |
- |
72 |
30 |
- |
30 |
|
A903 |
534 |
- |
545 |
99 |
- |
99 |
42 |
- |
42 |
72 |
- |
72 |
30 |
- |
30 |
Note: Bolded and underlined figure represents exceedance of relevant limits
stipulated in EIAO-TM and AQOs. The range of the results means the predicted
concentrations at the ASRs within the site at all assessment heights.
Tier 2 Assessment
3.10.3 Those ASRs with non-compliance in particulates levels under Tier 1 screening during the construction of the Project are selected to undergo Tier 2 assessment accordingly as discussed in Section 3.6. In Year 2019 – Year 2030 scenario, there are 69, 53 and 9 nos. of non-compliance ASRs required for TSP (hourly average), RSP (daily average) and FSP (daily average) Tier 2 assessment respectively. The active work areas of concurrent work contracts are positioned closest to the potentially worst affected ASRs. The individual affected ASR would be influenced by one active work area of each concurrent work contract. The predicted cumulative maximum hourly average TSP, 10th highest daily average RSP and FSP concentrations at the ASRs of Tier 2 scenarios are summarised in Table 3.38 and Table 3.39. The detailed prediction results are presented in Appendix 3.12.
Table 3.38 Predicted Construction Dust Impact on Project Sites with Air Sensitive Use in Year 2019 – Year 2030 (Mitigated, Tier 2)
|
Site |
Maximum Hourly TSP Conc. (µg/m3) |
10th Highest Daily RSP
Conc. (µg/m3) |
10th Highest Daily FSP
Conc. (µg/m3) |
||||||
|
2-18 |
169 |
- |
174 |
93 |
- |
95 |
69 |
- |
71 |
|
3-6 |
174 |
- |
469 |
94 |
- |
104 |
71 |
- |
72 |
|
3-7 |
174 |
- |
197 |
94 |
- |
97 |
71 |
- |
72 |
|
3-8 |
174 |
- |
374 |
94 |
- |
102 |
71 |
- |
73 |
|
4-20 |
174 |
- |
569 |
95 |
- |
102 |
70 |
- |
71 |
|
5-2 |
176 |
- |
364 |
92 |
- |
94 |
69 |
- |
69 |
|
5-22 |
173 |
- |
173 |
92 |
- |
92 |
69 |
- |
69 |
|
5-24 |
173 |
- |
223 |
92 |
- |
94 |
69 |
- |
69 |
|
5-26 |
173 |
- |
270 |
92 |
- |
94 |
69 |
- |
70 |
Note: Bolded
and underlined figure represents exceedance of relevant limits stipulated in
EIAO-TM and AQOs. The range of the results means the predicted concentrations
at the ASRs within the site at all assessment heights.
Table 3.39 Predicted Construction Dust Impact on Representative Existing ASRs in Year 2019 – Year 2030 (Mitigated, Tier 2)
|
ASR
ID |
Maximum Hourly TSP Conc. (µg/m3) |
10th Highest Daily RSP
Conc. (µg/m3) |
10th Highest Daily FSP
Conc. (µg/m3) |
||||||
|
A1001 |
174 |
- |
174 |
95 |
- |
95 |
71 |
- |
71 |
|
A1002 |
217 |
- |
393 |
96 |
- |
100 |
71 |
- |
71 |
|
A1004 |
174 |
- |
174 |
95 |
- |
95 |
71 |
- |
71 |
|
A102 |
180 |
- |
180 |
93 |
- |
94 |
70 |
- |
70 |
|
A103 |
180 |
- |
180 |
93 |
- |
94 |
70 |
- |
70 |
|
A104 |
180 |
- |
180 |
94 |
- |
94 |
70 |
- |
70 |
|
A105 |
180 |
- |
180 |
94 |
- |
94 |
70 |
- |
70 |
|
A106 |
180 |
- |
180 |
94 |
- |
94 |
70 |
- |
70 |
|
A107 |
180 |
- |
191 |
94 |
- |
94 |
70 |
- |
70 |
|
A108 |
180 |
- |
180 |
95 |
- |
95 |
70 |
- |
70 |
|
A109 |
180 |
- |
180 |
94 |
- |
95 |
70 |
- |
70 |
|
A110 |
180 |
- |
180 |
93 |
- |
93 |
70 |
- |
70 |
|
A111 |
180 |
- |
180 |
93 |
- |
93 |
70 |
- |
70 |
|
A112 |
181 |
- |
204 |
93 |
- |
94 |
70 |
- |
70 |
|
A1300 |
185 |
- |
259 |
94 |
- |
96 |
70 |
- |
71 |
|
A1501 |
248 |
- |
248 |
98 |
- |
98 |
73 |
- |
73 |
|
A201 |
173 |
- |
240 |
94 |
- |
96 |
70 |
- |
70 |
|
A202 |
173 |
- |
313 |
94 |
- |
97 |
70 |
- |
70 |
|
A203 |
174 |
- |
320 |
94 |
- |
97 |
70 |
- |
70 |
|
A204 |
174 |
- |
363 |
95 |
- |
98 |
70 |
- |
70 |
|
A205 |
174 |
- |
354 |
96 |
- |
98 |
70 |
- |
70 |
|
A206 |
178 |
- |
279 |
97 |
- |
98 |
71 |
- |
71 |
|
A207 |
175 |
- |
224 |
97 |
- |
97 |
70 |
- |
71 |
|
A208 |
187 |
- |
440 |
99 |
- |
102 |
71 |
- |
71 |
|
A209 |
174 |
- |
814 |
97 |
- |
109 |
70 |
- |
72 |
|
A301 |
179 |
- |
179 |
94 |
- |
94 |
70 |
- |
70 |
|
A302 |
179 |
- |
179 |
93 |
- |
94 |
70 |
- |
70 |
|
A303 |
179 |
- |
179 |
93 |
- |
94 |
70 |
- |
70 |
|
A304 |
179 |
- |
329 |
94 |
- |
96 |
70 |
- |
70 |
|
A305 |
180 |
- |
180 |
93 |
- |
93 |
70 |
- |
70 |
|
A306 |
179 |
- |
310 |
94 |
- |
96 |
70 |
- |
70 |
|
A307 |
179 |
- |
179 |
93 |
- |
94 |
70 |
- |
70 |
|
A308 |
179 |
- |
179 |
93 |
- |
93 |
70 |
- |
70 |
|
A309 |
179 |
- |
179 |
93 |
- |
94 |
70 |
- |
70 |
|
A310 |
683 |
- |
683 |
100 |
- |
100 |
71 |
- |
71 |
|
A311 |
179 |
- |
332 |
93 |
- |
97 |
70 |
- |
70 |
|
A312 |
179 |
- |
179 |
94 |
- |
94 |
70 |
- |
70 |
|
A313 |
179 |
- |
226 |
93 |
- |
95 |
70 |
- |
70 |
|
A314 |
179 |
- |
359 |
93 |
- |
97 |
70 |
- |
70 |
|
A410 |
192 |
- |
220 |
92 |
- |
92 |
69 |
- |
69 |
|
A415 |
193 |
- |
341 |
94 |
- |
95 |
69 |
- |
69 |
|
A416 |
173 |
- |
200 |
92 |
- |
92 |
69 |
- |
69 |
|
A502 |
181 |
- |
197 |
92 |
- |
93 |
69 |
- |
70 |
|
A503 |
181 |
- |
181 |
93 |
- |
93 |
70 |
- |
70 |
|
A601 |
175 |
- |
175 |
94 |
- |
94 |
70 |
- |
70 |
|
A602 |
175 |
- |
175 |
96 |
- |
96 |
71 |
- |
71 |
|
A603 |
176 |
- |
176 |
95 |
- |
95 |
71 |
- |
71 |
|
A701 |
172 |
- |
172 |
93 |
- |
93 |
69 |
- |
69 |
|
A702 |
172 |
- |
172 |
93 |
- |
93 |
69 |
- |
69 |
|
A703 |
172 |
- |
188 |
93 |
- |
94 |
69 |
- |
69 |
|
A704 |
172 |
- |
172 |
93 |
- |
93 |
69 |
- |
69 |
|
A903 |
174 |
- |
174 |
96 |
- |
96 |
72 |
- |
72 |
Note:
Bolded and underlined figure represents exceedance of relevant limits
stipulated in EIAO-TM and AQOs. The range of the results means the predicted
concentrations at the ASRs within the site at all assessment heights.
3.10.4 The contour plots of cumulative maximum hourly average TSP, 10th highest daily average RSP and FSP concentrations at 1.5 mAG of the above Tier 2 scenarios are presented in Figure 3.32 – Figure 3.34.
3.10.5 According to the above Tier 2 assessments, ASR P240 of Site 4-20, A209 and A310 would still exceed the criterion of hourly average TSP levels stipulated in EIAO-TM. ASR P1032 of Site 3-6, P1501 of Site 3-8, P240 of Site 4-20, A208, A209 and A310 would still exceed the criterion of daily average RSP levels stipulated in the AQOs. Tier 3 assessments for these ASRs are then conducted with reduction in active works area nearby to one-third of monthly average work. As confirmed by the Engineer, one-third of monthly average work area during any short period of time is considered practical applying for these ASRs. The predicted cumulative maximum hourly average TSP and 10th highest daily average RSP concentrations at the ASRs of Tier 3 scenario are summarised in Table 3.40. The results show that construction dust impact on these ASRs would all comply with the criteria with implementation of reduced active works area nearby. The contour plots of cumulative maximum hourly average TSP and 10th highest daily average RSP at 1.5 mAG are illustrated in Figure 3.38 and Figure 3.39.
Table 3.40 Predicted Construction Dust Impact on Affected ASRs in Year 2019 – Year 2030 (Mitigated, Tier 3)
|
ASR
ID |
Assessment Height (mAG) |
Maximum Hourly TSP Conc. (µg/m3) |
10th Highest Daily RSP Conc. (µg/m3) |
|
P240 |
1.5 |
311 |
99 |
|
5.0 |
177 |
96 |
|
|
10.0 |
174 |
94 |
|
|
A209 |
1.5 |
421 |
100 |
|
5.0 |
331 |
99 |
|
|
10.0 |
174 |
95 |
|
|
A310 |
1.5 |
478 |
98 |
|
ASR ID |
Assessment Height (mAG) |
10th Highest Daily RSP Conc. (µg/m3) |
|
|
P1032 |
1.5 |
99 |
|
|
5.0 |
97 |
||
|
10.0 |
95 |
||
|
20.0 |
94 |
||
|
40.0 |
94 |
||
|
80.0 |
94 |
||
|
P1501 |
1.5 |
98 |
|
|
5.0 |
97 |
||
|
10.0 |
97 |
||
|
20.0 |
97 |
||
|
40.0 |
97 |
||
|
80.0 |
96 |
||
|
A208 |
1.5 |
98 |
|
|
5.0 |
98 |
||
|
10.0 |
97 |
||
Note:
Bolded and underlined figure represents exceedance of relevant limits
stipulated in EIAO-TM and AQOs. The range of the results means the predicted
concentrations at the ASRs within the site at all assessment heights.
Year 2031 – Year 2036 Scenario
Tier 1 Assessment
3.10.6 With the implementation of the above measures, the predicted cumulative maximum hourly average TSP, 10th highest daily and annual average RSP and FSP concentrations at the representative ASRs are summarised in Table 3.41 and Table 3.42. The detailed assessment results are presented in Appendix 3.11.
Table 3.41 Predicted Construction Dust Impact on Project Sites with Air Sensitive Use in Year 2031 – Year 2036 (Mitigated, Tier 1)
|
Site / ASR ID |
Maximum Hourly TSP Conc. (µg/m3) |
10th Highest Daily RSP
Conc. (µg/m3) |
Annual RSP Conc. (µg/m3) |
10th Highest Daily FSP
Conc. (µg/m3) |
Annual FSP Conc. (µg/m3) |
||||||||||
|
2-18 |
504 |
- |
722 |
102 |
- |
109 |
41 |
- |
42 |
71 |
- |
72 |
29 |
- |
30 |
|
2-19 |
425 |
- |
506 |
100 |
- |
101 |
42 |
- |
42 |
72 |
- |
72 |
30 |
- |
30 |
|
3-1 |
175 |
- |
599 |
95 |
- |
103 |
42 |
- |
42 |
71 |
- |
72 |
30 |
- |
30 |
|
3-11 |
176 |
- |
520 |
95 |
- |
106 |
41 |
- |
43 |
71 |
- |
73 |
29 |
- |
30 |
|
3-13 |
175 |
- |
1199 |
95 |
- |
120 |
41 |
- |
43 |
71 |
- |
76 |
29 |
- |
30 |
|
3-14 |
176 |
- |
1127 |
96 |
- |
122 |
41 |
- |
43 |
71 |
- |
75 |
29 |
- |
30 |
|
3-18 |
176 |
- |
1372 |
95 |
- |
125 |
41 |
- |
43 |
71 |
- |
75 |
29 |
- |
30 |
|
3-4 |
175 |
- |
586 |
95 |
- |
102 |
42 |
- |
42 |
71 |
- |
72 |
30 |
- |
30 |
|
3-43 |
176 |
- |
538 |
95 |
- |
102 |
42 |
- |
43 |
71 |
- |
72 |
30 |
- |
30 |
|
3-44 |
176 |
- |
495 |
95 |
- |
99 |
42 |
- |
43 |
71 |
- |
72 |
30 |
- |
30 |
|
3-45 |
176 |
- |
477 |
95 |
- |
99 |
42 |
- |
43 |
71 |
- |
72 |
30 |
- |
30 |
|
3-5 |
175 |
- |
537 |
95 |
- |
100 |
42 |
- |
42 |
71 |
- |
72 |
30 |
- |
30 |
|
3-50 |
173 |
- |
340 |
93 |
- |
97 |
42 |
- |
43 |
70 |
- |
71 |
30 |
- |
30 |
|
3-51 |
173 |
- |
285 |
93 |
- |
96 |
42 |
- |
42 |
70 |
- |
70 |
30 |
- |
30 |
|
3-52 |
173 |
- |
256 |
93 |
- |
96 |
42 |
- |
43 |
70 |
- |
71 |
30 |
- |
31 |
|
3-6 |
175 |
- |
506 |
95 |
- |
100 |
42 |
- |
42 |
71 |
- |
71 |
30 |
- |
30 |
|
3-7 |
174 |
- |
367 |
95 |
- |
97 |
42 |
- |
42 |
71 |
- |
72 |
30 |
- |
30 |
|
3-8 |
174 |
- |
480 |
95 |
- |
102 |
42 |
- |
43 |
71 |
- |
73 |
30 |
- |
30 |
|
4-1 |
176 |
- |
650 |
95 |
- |
101 |
42 |
- |
43 |
70 |
- |
73 |
30 |
- |
30 |
|
4-10 |
176 |
- |
314 |
94 |
- |
98 |
42 |
- |
42 |
70 |
- |
71 |
30 |
- |
30 |
|
4-12a |
173 |
- |
269 |
93 |
- |
96 |
42 |
- |
42 |
70 |
- |
70 |
30 |
- |
30 |
|
4-12b |
173 |
- |
280 |
93 |
- |
96 |
42 |
- |
42 |
70 |
- |
70 |
30 |
- |
30 |
|
4-12c |
176 |
- |
285 |
94 |
- |
96 |
42 |
- |
42 |
70 |
- |
71 |
30 |
- |
30 |
|
4-12d |
173 |
- |
250 |
93 |
- |
95 |
42 |
- |
42 |
70 |
- |
70 |
30 |
- |
30 |
|
4-13a |
173 |
- |
304 |
93 |
- |
96 |
42 |
- |
42 |
70 |
- |
70 |
30 |
- |
30 |
|
4-13b |
173 |
- |
339 |
93 |
- |
96 |
42 |
- |
42 |
70 |
- |
71 |
30 |
- |
30 |
|
4-14 |
227 |
- |
382 |
95 |
- |
97 |
42 |
- |
42 |
70 |
- |
71 |
30 |
- |
30 |
|
4-15 |
173 |
- |
259 |
93 |
- |
96 |
42 |
- |
42 |
70 |
- |
70 |
30 |
- |
30 |
|
4-16 |
173 |
- |
237 |
93 |
- |
95 |
42 |
- |
42 |
70 |
- |
70 |
30 |
- |
30 |
|
4-17 |
173 |
- |
240 |
93 |
- |
95 |
42 |
- |
42 |
70 |
- |
70 |
30 |
- |
30 |
|
4-2 |
176 |
- |
516 |
96 |
- |
98 |
42 |
- |
42 |
71 |
- |
72 |
30 |
- |
30 |
|
4-20 |
173 |
- |
194 |
93 |
- |
94 |
42 |
- |
42 |
70 |
- |
70 |
30 |
- |
30 |
|
4-21 |
173 |
- |
204 |
93 |
- |
94 |
42 |
- |
42 |
70 |
- |
70 |
30 |
- |
30 |
|
4-22 |
173 |
- |
279 |
93 |
- |
95 |
42 |
- |
42 |
70 |
- |
70 |
30 |
- |
30 |
|
4-24 |
179 |
- |
187 |
93 |
- |
94 |
42 |
- |
42 |
70 |
- |
70 |
30 |
- |
30 |
|
4-25a |
173 |
- |
386 |
93 |
- |
95 |
42 |
- |
42 |
70 |
- |
70 |
30 |
- |
30 |
|
4-25b |
173 |
- |
214 |
92 |
- |
94 |
41 |
- |
42 |
69 |
- |
70 |
29 |
- |
30 |
|
4-25c |
173 |
- |
424 |
93 |
- |
96 |
42 |
- |
42 |
70 |
- |
71 |
30 |
- |
30 |
|
4-26 |
179 |
- |
179 |
93 |
- |
94 |
42 |
- |
42 |
70 |
- |
70 |
30 |
- |
30 |
|
4-28 |
173 |
- |
345 |
93 |
- |
95 |
42 |
- |
42 |
70 |
- |
70 |
30 |
- |
30 |
|
4-29 |
173 |
- |
400 |
93 |
- |
95 |
42 |
- |
42 |
70 |
- |
70 |
30 |
- |
30 |
|
4-3 |
176 |
- |
591 |
95 |
- |
105 |
42 |
- |
42 |
70 |
- |
73 |
30 |
- |
30 |
|
4-31 |
173 |
- |
367 |
93 |
- |
95 |
42 |
- |
42 |
70 |
- |
70 |
30 |
- |
30 |
|
4-32 |
173 |
- |
352 |
93 |
- |
95 |
42 |
- |
42 |
70 |
- |
70 |
30 |
- |
30 |
|
4-33 |
208 |
- |
319 |
93 |
- |
95 |
42 |
- |
42 |
70 |
- |
70 |
30 |
- |
30 |
|
4-36 |
188 |
- |
284 |
93 |
- |
95 |
42 |
- |
42 |
70 |
- |
70 |
30 |
- |
30 |
|
4-4 |
176 |
- |
422 |
94 |
- |
98 |
42 |
- |
42 |
70 |
- |
72 |
30 |
- |
30 |
|
4-5 |
176 |
- |
339 |
94 |
- |
97 |
42 |
- |
42 |
70 |
- |
71 |
30 |
- |
30 |
|
4-6 |
176 |
- |
769 |
94 |
- |
102 |
42 |
- |
42 |
70 |
- |
72 |
30 |
- |
30 |
|
4-8 |
176 |
- |
493 |
95 |
- |
99 |
42 |
- |
42 |
71 |
- |
72 |
30 |
- |
30 |
|
4-9 |
176 |
- |
334 |
94 |
- |
97 |
42 |
- |
42 |
70 |
- |
71 |
30 |
- |
30 |
|
5-1 |
176 |
- |
453 |
92 |
- |
97 |
41 |
- |
41 |
69 |
- |
70 |
29 |
- |
29 |
|
5-16 |
172 |
- |
1222 |
92 |
- |
110 |
41 |
- |
42 |
69 |
- |
72 |
29 |
- |
29 |
|
5-17 |
172 |
- |
1137 |
92 |
- |
112 |
41 |
- |
42 |
69 |
- |
72 |
29 |
- |
29 |
|
5-18a |
172 |
- |
1215 |
92 |
- |
116 |
41 |
- |
42 |
69 |
- |
73 |
29 |
- |
29 |
|
5-18b |
172 |
- |
961 |
92 |
- |
115 |
41 |
- |
42 |
69 |
- |
72 |
29 |
- |
29 |
|
5-2 |
176 |
- |
446 |
92 |
- |
96 |
41 |
- |
41 |
69 |
- |
70 |
29 |
- |
29 |
|
5-21 |
172 |
- |
1609 |
93 |
- |
142 |
41 |
- |
44 |
69 |
- |
76 |
29 |
- |
29 |
|
5-22 |
174 |
- |
531 |
93 |
- |
96 |
41 |
- |
41 |
69 |
- |
69 |
29 |
- |
29 |
|
5-23 |
174 |
- |
514 |
92 |
- |
93 |
41 |
- |
41 |
69 |
- |
69 |
29 |
- |
29 |
|
5-24 |
173 |
- |
510 |
92 |
- |
94 |
41 |
- |
41 |
69 |
- |
69 |
29 |
- |
29 |
|
5-26 |
174 |
- |
461 |
92 |
- |
92 |
41 |
- |
41 |
69 |
- |
69 |
29 |
- |
29 |
|
5-27 |
199 |
- |
428 |
92 |
- |
93 |
41 |
- |
41 |
69 |
- |
69 |
29 |
- |
29 |
|
5-28 |
201 |
- |
401 |
92 |
- |
93 |
41 |
- |
41 |
69 |
- |
69 |
29 |
- |
29 |
|
5-32 |
173 |
- |
316 |
92 |
- |
93 |
41 |
- |
41 |
69 |
- |
69 |
29 |
- |
29 |
|
5-33 |
173 |
- |
420 |
92 |
- |
93 |
41 |
- |
41 |
69 |
- |
69 |
29 |
- |
29 |
|
5-37 |
174 |
- |
416 |
92 |
- |
92 |
41 |
- |
41 |
69 |
- |
69 |
29 |
- |
29 |
|
5-38 |
276 |
- |
325 |
92 |
- |
92 |
41 |
- |
41 |
69 |
- |
69 |
29 |
- |
29 |
|
5-3a |
172 |
- |
647 |
92 |
- |
115 |
41 |
- |
42 |
69 |
- |
72 |
29 |
- |
29 |
|
5-3b |
176 |
- |
698 |
92 |
- |
108 |
41 |
- |
42 |
69 |
- |
71 |
29 |
- |
29 |
|
5-6 |
303 |
- |
540 |
94 |
- |
101 |
41 |
- |
41 |
69 |
- |
70 |
29 |
- |
29 |
Note: Bolded and underlined figure represents exceedance of relevant limits
stipulated in EIAO-TM and AQOs. The range of the results means the predicted
concentrations at the ASRs within the site at all assessment heights.
Table 3.42 Predicted Construction Dust Impact on Representative Existing ASRs in Year 2031 – Year 2036 (Mitigated, Tier 1)
|
ASR
ID |
Maximum
Hourly TSP Conc. (µg/m3) |
10th
Highest Daily RSP Conc. (µg/m3) |
Annual
RSP Conc. (µg/m3) |
10th
Highest Daily FSP Conc. (µg/m3) |
Annual
FSP Conc. (µg/m3) |
||||||||||
|
A1001 |
398 |
- |
432 |
98 |
- |
98 |
42 |
- |
42 |
71 |
- |
71 |
30 |
- |
30 |
|
A1002 |
556 |
- |
649 |
103 |
- |
103 |
42 |
- |
42 |
72 |
- |
72 |
30 |
- |
30 |
|
A1003 |
338 |
- |
472 |
99 |
- |
101 |
42 |
- |
42 |
71 |
- |
72 |
30 |
- |
30 |
|
A1004 |
332 |
- |
363 |
98 |
- |
99 |
42 |
- |
42 |
71 |
- |
71 |
30 |
- |
30 |
|
A1005 |
287 |
- |
391 |
99 |
- |
100 |
42 |
- |
42 |
71 |
- |
71 |
30 |
- |
30 |
|
A102 |
180 |
- |
389 |
93 |
- |
94 |
42 |
- |
43 |
70 |
- |
70 |
30 |
- |
30 |
|
A103 |
180 |
- |
369 |
93 |
- |
94 |
42 |
- |
42 |
70 |
- |
70 |
30 |
- |
30 |
|
A104 |
322 |
- |
356 |
94 |
- |
94 |
42 |
- |
42 |
70 |
- |
70 |
30 |
- |
30 |
|
A105 |
293 |
- |
327 |
94 |
- |
94 |
42 |
- |
42 |
70 |
- |
70 |
30 |
- |
30 |
|
A106 |
308 |
- |
333 |
94 |
- |
94 |
42 |
- |
42 |
70 |
- |
70 |
30 |
- |
30 |
|
A107 |
308 |
- |
346 |
94 |
- |
94 |
42 |
- |
42 |
70 |
- |
70 |
30 |
- |
30 |
|
A108 |
314 |
- |
333 |
94 |
- |
94 |
42 |
- |
42 |
70 |
- |
70 |
30 |
- |
30 |
|
A109 |
320 |
- |
327 |
94 |
- |
95 |
42 |
- |
42 |
70 |
- |
70 |
30 |
- |
30 |
|
A110 |
292 |
- |
311 |
93 |
- |
93 |
42 |
- |
42 |
70 |
- |
70 |
30 |
- |
30 |
|
A1101 |
786 |
- |
1005 |
120 |
- |
130 |
42 |
- |
43 |
74 |
- |
75 |
29 |
- |
29 |
|
A1102 |
451 |
- |
1336 |
111 |
- |
126 |
42 |
- |
42 |
72 |
- |
74 |
29 |
- |
29 |
|
A1103 |
172 |
- |
911 |
92 |
- |
110 |
41 |
- |
41 |
69 |
- |
71 |
29 |
- |
29 |
|
A1104 |
172 |
- |
994 |
92 |
- |
111 |
41 |
- |
41 |
69 |
- |
70 |
29 |
- |
29 |
|
A1105 |
172 |
- |
704 |
92 |
- |
99 |
41 |
- |
41 |
69 |
- |
70 |
29 |
- |
29 |
|
A1106 |
172 |
- |
1038 |
92 |
- |
110 |
41 |
- |
41 |
69 |
- |
72 |
29 |
- |
29 |
|
A1107 |
172 |
- |
715 |
92 |
- |
100 |
41 |
- |
41 |
69 |
- |
70 |
29 |
- |
29 |
|
A1108 |
172 |
- |
1055 |
93 |
- |
111 |
41 |
- |
41 |
69 |
- |
72 |
29 |
- |
29 |
|
A1109 |
172 |
- |
661 |
92 |
- |
99 |
41 |
- |
41 |
69 |
- |
70 |
29 |
- |
29 |
|
A111 |
314 |
- |
345 |
93 |
- |
93 |
42 |
- |
42 |
70 |
- |
70 |
30 |
- |
30 |
|
A112 |
311 |
- |
330 |
93 |
- |
93 |
42 |
- |
42 |
70 |
- |
70 |
30 |
- |
30 |
|
A1201 |
173 |
- |
313 |
92 |
- |
93 |
41 |
- |
41 |
69 |
- |
69 |
29 |
- |
29 |
|
A1202 |
173 |
- |
288 |
92 |
- |
92 |
41 |
- |
41 |
69 |
- |
69 |
29 |
- |
29 |
|
A1203 |
173 |
- |
305 |
92 |
- |
92 |
41 |
- |
41 |
69 |
- |
69 |
29 |
- |
29 |
|
A1300 |
484 |
- |
1123 |
106 |
- |
126 |
42 |
- |
43 |
73 |
- |
78 |
29 |
- |
30 |
|
A1301 |
423 |
- |
486 |
96 |
- |
96 |
41 |
- |
41 |
69 |
- |
70 |
29 |
- |
29 |
|
A1302 |
404 |
- |
619 |
97 |
- |
99 |
41 |
- |
41 |
70 |
- |
70 |
29 |
- |
29 |
|
A1303 |
584 |
- |
606 |
99 |
- |
100 |
41 |
- |
41 |
70 |
- |
70 |
29 |
- |
29 |
|
A1304 |
579 |
- |
623 |
99 |
- |
100 |
41 |
- |
41 |
70 |
- |
70 |
29 |
- |
29 |
|
A1305 |
504 |
- |
575 |
98 |
- |
98 |
41 |
- |
41 |
70 |
- |
70 |
29 |
- |
29 |
|
A1306 |
446 |
- |
457 |
96 |
- |
97 |
41 |
- |
41 |
70 |
- |
70 |
29 |
- |
29 |
|
A1307 |
446 |
- |
687 |
96 |
- |
97 |
41 |
- |
41 |
70 |
- |
70 |
29 |
- |
29 |
|
A1308 |
308 |
- |
320 |
94 |
- |
96 |
41 |
- |
41 |
69 |
- |
69 |
29 |
- |
29 |
|
A1309 |
248 |
- |
272 |
93 |
- |
93 |
41 |
- |
41 |
69 |
- |
69 |
29 |
- |
29 |
|
A1401 |
433 |
- |
446 |
93 |
- |
93 |
41 |
- |
41 |
69 |
- |
69 |
29 |
- |
29 |
|
A1402 |
170 |
- |
340 |
92 |
- |
94 |
40 |
- |
41 |
68 |
- |
69 |
29 |
- |
29 |
|
A1403 |
170 |
- |
319 |
91 |
- |
93 |
40 |
- |
41 |
68 |
- |
69 |
29 |
- |
29 |
|
A1404 |
170 |
- |
225 |
91 |
- |
93 |
40 |
- |
41 |
68 |
- |
69 |
29 |
- |
29 |
|
A1405 |
170 |
- |
261 |
91 |
- |
93 |
40 |
- |
41 |
68 |
- |
69 |
29 |
- |
29 |
|
A1501 |
294 |
- |
294 |
100 |
- |
100 |
43 |
- |
43 |
73 |
- |
73 |
30 |
- |
30 |
|
A201 |
245 |
- |
274 |
95 |
- |
95 |
42 |
- |
42 |
70 |
- |
70 |
30 |
- |
30 |
|
A202 |
219 |
- |
238 |
95 |
- |
95 |
42 |
- |
42 |
70 |
- |
70 |
30 |
- |
30 |
|
A203 |
211 |
- |
228 |
95 |
- |
95 |
42 |
- |
42 |
70 |
- |
70 |
30 |
- |
30 |
|
A204 |
235 |
- |
259 |
95 |
- |
95 |
42 |
- |
42 |
70 |
- |
70 |
30 |
- |
30 |
|
A205 |
263 |
- |
295 |
95 |
- |
95 |
42 |
- |
42 |
70 |
- |
70 |
30 |
- |
30 |
|
A206 |
173 |
- |
183 |
93 |
- |
93 |
42 |
- |
42 |
70 |
- |
70 |
30 |
- |
30 |
|
A207 |
177 |
- |
178 |
93 |
- |
93 |
42 |
- |
42 |
70 |
- |
70 |
30 |
- |
30 |
|
A208 |
189 |
- |
193 |
94 |
- |
94 |
42 |
- |
42 |
70 |
- |
70 |
30 |
- |
30 |
|
A209 |
285 |
- |
309 |
95 |
- |
95 |
42 |
- |
42 |
70 |
- |
70 |
30 |
- |
30 |
|
A301 |
179 |
- |
179 |
93 |
- |
93 |
42 |
- |
42 |
70 |
- |
70 |
30 |
- |
30 |
|
A302 |
179 |
- |
179 |
94 |
- |
94 |
42 |
- |
42 |
70 |
- |
70 |
30 |
- |
30 |
|
A303 |
179 |
- |
179 |
94 |
- |
94 |
42 |
- |
42 |
70 |
- |
70 |
30 |
- |
30 |
|
A304 |
179 |
- |
179 |
94 |
- |
94 |
42 |
- |
42 |
70 |
- |
70 |
30 |
- |
30 |
|
A305 |
179 |
- |
179 |
94 |
- |
94 |
42 |
- |
42 |
70 |
- |
70 |
30 |
- |
30 |
|
A306 |
179 |
- |
179 |
94 |
- |
94 |
42 |
- |
42 |
70 |
- |
70 |
30 |
- |
30 |
|
A307 |
179 |
- |
179 |
94 |
- |
94 |
42 |
- |
42 |
70 |
- |
70 |
30 |
- |
30 |
|
A308 |
179 |
- |
179 |
94 |
- |
94 |
42 |
- |
42 |
70 |
- |
70 |
30 |
- |
30 |
|
A309 |
179 |
- |
179 |
94 |
- |
94 |
42 |
- |
42 |
70 |
- |
70 |
30 |
- |
30 |
|
A310 |
179 |
- |
179 |
94 |
- |
94 |
42 |
- |
42 |
70 |
- |
70 |
30 |
- |
30 |
|
A311 |
179 |
- |
179 |
94 |
- |
94 |
42 |
- |
42 |
70 |
- |
70 |
30 |
- |
30 |
|
A312 |
212 |
- |
252 |
94 |
- |
94 |
42 |
- |
42 |
70 |
- |
70 |
30 |
- |
30 |
|
A313 |
179 |
- |
187 |
94 |
- |
94 |
42 |
- |
42 |
70 |
- |
70 |
30 |
- |
30 |
|
A314 |
179 |
- |
179 |
94 |
- |
94 |
42 |
- |
42 |
70 |
- |
70 |
30 |
- |
30 |
|
A401 |
265 |
- |
281 |
92 |
- |
92 |
41 |
- |
41 |
69 |
- |
69 |
29 |
- |
29 |
|
A402 |
314 |
- |
353 |
92 |
- |
92 |
41 |
- |
41 |
69 |
- |
69 |
29 |
- |
29 |
|
A403 |
173 |
- |
362 |
92 |
- |
92 |
41 |
- |
41 |
69 |
- |
69 |
29 |
- |
29 |
|
A404 |
279 |
- |
331 |
92 |
- |
92 |
41 |
- |
41 |
69 |
- |
69 |
29 |
- |
29 |
|
A405 |
173 |
- |
285 |
92 |
- |
92 |
41 |
- |
41 |
69 |
- |
69 |
29 |
- |
29 |
|
A406 |
288 |
- |
308 |
92 |
- |
93 |
41 |
- |
41 |
69 |
- |
69 |
29 |
- |
29 |
|
A407 |
612 |
- |
624 |
93 |
- |
94 |
41 |
- |
41 |
69 |
- |
69 |
29 |
- |
29 |
|
A408 |
382 |
- |
421 |
94 |
- |
94 |
41 |
- |
41 |
69 |
- |
69 |
29 |
- |
29 |
|
A409 |
174 |
- |
366 |
93 |
- |
94 |
41 |
- |
41 |
69 |
- |
70 |
29 |
- |
29 |
|
A410 |
432 |
- |
467 |
100 |
- |
101 |
42 |
- |
42 |
70 |
- |
70 |
29 |
- |
29 |
|
A411 |
454 |
- |
478 |
96 |
- |
96 |
41 |
- |
41 |
69 |
- |
69 |
29 |
- |
29 |
|
A412 |
443 |
- |
482 |
99 |
- |
100 |
42 |
- |
42 |
70 |
- |
70 |
29 |
- |
29 |
|
A413 |
358 |
- |
376 |
96 |
- |
97 |
41 |
- |
41 |
69 |
- |
70 |
29 |
- |
29 |
|
A414 |
524 |
- |
544 |
97 |
- |
98 |
41 |
- |
41 |
69 |
- |
69 |
29 |
- |
29 |
|
A415 |
264 |
- |
299 |
93 |
- |
93 |
41 |
- |
41 |
69 |
- |
69 |
29 |
- |
29 |
|
A416 |
174 |
- |
333 |
92 |
- |
93 |
41 |
- |
41 |
69 |
- |
69 |
29 |
- |
29 |
|
A502 |
181 |
- |
612 |
93 |
- |
98 |
41 |
- |
42 |
69 |
- |
70 |
29 |
- |
29 |
|
A503 |
272 |
- |
579 |
94 |
- |
99 |
42 |
- |
42 |
70 |
- |
70 |
29 |
- |
29 |
|
A504 |
634 |
- |
694 |
96 |
- |
97 |
42 |
- |
42 |
70 |
- |
70 |
29 |
- |
29 |
|
A505 |
446 |
- |
553 |
95 |
- |
96 |
42 |
- |
42 |
69 |
- |
70 |
29 |
- |
29 |
|
A506 |
652 |
- |
909 |
99 |
- |
99 |
42 |
- |
42 |
70 |
- |
71 |
29 |
- |
29 |
|
A507 |
262 |
- |
644 |
93 |
- |
97 |
41 |
- |
42 |
69 |
- |
70 |
29 |
- |
29 |
|
A508 |
461 |
- |
592 |
96 |
- |
97 |
41 |
- |
42 |
69 |
- |
70 |
29 |
- |
29 |
|
A601 |
741 |
- |
1143 |
118 |
- |
123 |
42 |
- |
43 |
74 |
- |
75 |
30 |
- |
30 |
|
A602 |
694 |
- |
694 |
110 |
- |
110 |
42 |
- |
42 |
74 |
- |
74 |
30 |
- |
30 |
|
A603 |
606 |
- |
606 |
107 |
- |
107 |
42 |
- |
42 |
73 |
- |
73 |
30 |
- |
30 |
|
A701 |
737 |
- |
1368 |
120 |
- |
143 |
42 |
- |
43 |
74 |
- |
76 |
29 |
- |
29 |
|
A702 |
672 |
- |
1013 |
121 |
- |
133 |
42 |
- |
43 |
73 |
- |
76 |
29 |
- |
29 |
|
A703 |
598 |
- |
1285 |
112 |
- |
122 |
42 |
- |
42 |
72 |
- |
73 |
29 |
- |
29 |
|
A704 |
547 |
- |
1419 |
121 |
- |
131 |
42 |
- |
43 |
74 |
- |
75 |
29 |
- |
29 |
|
A705 |
524 |
- |
1422 |
120 |
- |
146 |
43 |
- |
44 |
73 |
- |
76 |
29 |
- |
29 |
|
A706 |
594 |
- |
793 |
117 |
- |
125 |
42 |
- |
42 |
72 |
- |
73 |
29 |
- |
29 |
|
A707 |
172 |
- |
1149 |
93 |
- |
109 |
41 |
- |
41 |
69 |
- |
71 |
29 |
- |
29 |
|
A708 |
767 |
- |
1392 |
125 |
- |
134 |
42 |
- |
43 |
73 |
- |
75 |
29 |
- |
29 |
|
A801 |
528 |
- |
542 |
96 |
- |
96 |
41 |
- |
41 |
70 |
- |
70 |
29 |
- |
29 |
|
A802 |
451 |
- |
471 |
96 |
- |
96 |
41 |
- |
41 |
70 |
- |
70 |
29 |
- |
29 |
|
A803 |
330 |
- |
408 |
93 |
- |
94 |
41 |
- |
41 |
69 |
- |
70 |
29 |
- |
29 |
|
A804 |
322 |
- |
323 |
93 |
- |
93 |
41 |
- |
41 |
69 |
- |
69 |
29 |
- |
29 |
|
A805 |
311 |
- |
332 |
93 |
- |
93 |
41 |
- |
41 |
69 |
- |
69 |
29 |
- |
29 |
|
A806 |
233 |
- |
276 |
93 |
- |
93 |
41 |
- |
41 |
69 |
- |
69 |
29 |
- |
29 |
|
A807 |
243 |
- |
250 |
93 |
- |
93 |
41 |
- |
41 |
69 |
- |
69 |
29 |
- |
29 |
|
A808 |
176 |
- |
419 |
93 |
- |
95 |
41 |
- |
41 |
69 |
- |
70 |
29 |
- |
29 |
|
A809 |
176 |
- |
265 |
92 |
- |
93 |
41 |
- |
41 |
69 |
- |
69 |
29 |
- |
29 |
|
A810 |
176 |
- |
260 |
92 |
- |
93 |
41 |
- |
41 |
69 |
- |
69 |
29 |
- |
29 |
|
A811 |
176 |
- |
271 |
92 |
- |
93 |
41 |
- |
41 |
69 |
- |
69 |
29 |
- |
29 |
|
A812 |
176 |
- |
312 |
92 |
- |
94 |
41 |
- |
41 |
69 |
- |
69 |
29 |
- |
29 |
|
A813 |
176 |
- |
523 |
92 |
- |
94 |
41 |
- |
41 |
69 |
- |
70 |
29 |
- |
29 |
|
A901 |
187 |
- |
203 |
96 |
- |
96 |
42 |
- |
42 |
72 |
- |
72 |
30 |
- |
30 |
|
A902 |
213 |
- |
217 |
96 |
- |
96 |
42 |
- |
42 |
72 |
- |
72 |
30 |
- |
30 |
|
A903 |
277 |
- |
287 |
96 |
- |
96 |
42 |
- |
42 |
72 |
- |
72 |
30 |
- |
30 |
Note: Bolded and underlined figure represents exceedance of relevant
limits stipulated in EIAO-TM and AQOs. The range of the results means the
predicted concentrations at the ASRs within the site at all assessment heights.
3.10.7 The contour plots of cumulative maximum hourly average TSP, 10th highest daily and annual average RSP and FSP concentrations at 1.5 mAG (the worst hit level) are presented in Figures 3.27 - 3.31.
3.10.8 Based on the prediction of Tier 1 screening, the predicted hourly average TSP levels and daily average RSP and FSP levels would still exceed the criterion stipulated in EIAO-TM and AQOs while the predicted annual average RSP and FSP levels at all the Project sites and representative ASRs would comply with the criteria of AQOs.
3.10.9 Those ASRs with non-compliance in particulates levels under Tier 1 screening during the construction of the Project are selected to undergo Tier 2 assessment. As discussed in Section 3.6, Tier 2 assessment is undertaken whereby monthly average works areas of the concurrent work contracts according to the construction work programme are considered as active work areas in the assessment. The active work areas of concurrent work contracts are positioned closest to the potentially worst affected ASRs. The individual affected ASR would be influenced by one active work area of each concurrent work contract. In Year 2031 – 2036 scenario, 97, 84 and 12 nos. non-compliance ASRs are required for TSP (hourly average), RSP (daily average) and FSP (daily average) Tier 2 assessment respectively. As the non-compliance ASRs are scattered around the Project Site, Tier 2 has divided into 5 scenarios for modelling based on the locations of the affected ASRs:
· Tier 2 East – for the clusters of affected ASRs at East of the Project area
· Tier 2 South – for the clusters of affected ASRs at South of the Project area
· Tier 2 West – for the clusters of affected ASRs at West of the Project area
· Tier 2 North – for the clusters of affected ASRs at North of the Project area
· Tier 2 Central – for the clusters of affected ASRs in the Central of the Project area
3.10.10 The predicted cumulative maximum hourly average TSP, 10th highest daily average RSP and FSP concentrations at the ASRs of Tier 2 scenarios are summarised in Table 3.43 to Table 3.51. The detailed prediction results are presented in Appendix 3.12.
Table 3.43 Predicted Construction Dust Impact on Representative Existing ASRs in Year 2031 – Year 2036 (Mitigated, Tier 2 Central)
|
ASR
ID |
Maximum Hourly TSP Conc. (µg/m3) |
10th Highest Daily RSP
Conc. (µg/m3) |
10th Highest Daily FSP
Conc. (µg/m3) |
||||||
|
A1001 |
174 |
- |
174 |
95 |
- |
95 |
71 |
- |
71 |
|
A1002 |
174 |
- |
174 |
95 |
- |
95 |
71 |
- |
71 |
|
A601 |
175 |
- |
204 |
95 |
- |
96 |
71 |
- |
71 |
|
A701 |
174 |
- |
319 |
94 |
- |
98 |
69 |
- |
70 |
|
A702 |
172 |
- |
430 |
93 |
- |
101 |
69 |
- |
70 |
|
A703 |
173 |
- |
312 |
94 |
- |
95 |
69 |
- |
69 |
|
A704 |
173 |
- |
185 |
94 |
- |
95 |
69 |
- |
69 |
|
A705 |
173 |
- |
224 |
94 |
- |
98 |
69 |
- |
70 |
|
A706 |
172 |
- |
173 |
94 |
- |
95 |
69 |
- |
69 |
|
A708 |
172 |
- |
303 |
94 |
- |
95 |
69 |
- |
69 |
Note: Bolded and underlined figure represents exceedance of relevant limits
stipulated in EIAO-TM and AQOs. The range of the results means the predicted
concentrations at the ASRs within the site at all assessment heights.
Table 3.44 Predicted Construction Dust Impact on Project Sites with Air Sensitive Use in Year 2031 – Year 2036 (Mitigated, Tier 2 East)
|
Site
/ ASR ID |
Maximum Hourly TSP Conc. (µg/m3) |
10th Highest Daily RSP
Conc. (µg/m3) |
10th Highest Daily FSP
Conc. (µg/m3) |
||||||
|
5-16 |
172 |
- |
328 |
92 |
- |
95 |
69 |
- |
70 |
|
5-17 |
172 |
- |
300 |
92 |
- |
95 |
69 |
- |
69 |
|
5-18a |
172 |
- |
336 |
92 |
- |
95 |
69 |
- |
69 |
|
5-18b |
172 |
- |
243 |
92 |
- |
94 |
69 |
- |
69 |
|
5-21 |
172 |
- |
172 |
92 |
- |
93 |
69 |
- |
69 |
|
5-3a |
172 |
- |
267 |
92 |
- |
94 |
69 |
- |
69 |
|
5-3b |
176 |
- |
229 |
92 |
- |
94 |
69 |
- |
69 |
|
5-6 |
176 |
- |
195 |
92 |
- |
93 |
69 |
- |
69 |
Note: Bolded and underlined figure represents exceedance of relevant
AQO. The range of the results means the predicted concentrations at the ASRs
within the site at all assessment heights.
Table 3.45 Predicted Construction Dust Impact on Representative Existing ASRs in Year 2031 – Year 2036 (Mitigated, Tier 2 East)
|
ASR
ID |
Maximum Hourly TSP Conc. (µg/m3) |
10th Highest Daily RSP
Conc. (µg/m3) |
10th Highest Daily FSP
Conc. (µg/m3) |
||||||
|
A1103 |
172 |
- |
172 |
92 |
- |
93 |
69 |
- |
69 |
|
A1104 |
172 |
- |
203 |
92 |
- |
93 |
69 |
- |
69 |
|
A1105 |
172 |
- |
172 |
92 |
- |
93 |
69 |
- |
69 |
|
A1106 |
172 |
- |
232 |
92 |
- |
93 |
69 |
- |
69 |
|
A1107 |
172 |
- |
172 |
92 |
- |
92 |
69 |
- |
69 |
|
A1108 |
172 |
- |
225 |
92 |
- |
93 |
69 |
- |
69 |
|
A1109 |
172 |
- |
172 |
92 |
- |
92 |
69 |
- |
69 |
|
A414 |
173 |
- |
173 |
92 |
- |
92 |
69 |
- |
69 |
|
A707 |
172 |
- |
172 |
92 |
- |
93 |
69 |
- |
69 |
|
A801 |
176 |
- |
196 |
93 |
- |
93 |
69 |
- |
69 |
|
A813 |
176 |
- |
176 |
92 |
- |
92 |
69 |
- |
69 |
Note: Bolded and underlined figure represents exceedance of relevant
limits stipulated in EIAO-TM and AQOs. The range of the results means the predicted
concentrations at the ASRs within the site at all assessment heights.
Table 3.46 Predicted Construction Dust Impact on Project Sites with Air Sensitive Use in Year 2031 – Year 2036 (Mitigated, Tier 2 North)
|
Site
/ ASR ID |
Maximum Hourly TSP Conc. (µg/m3) |
10th Highest Daily RSP
Conc. (µg/m3) |
10th Highest Daily FSP
Conc. (µg/m3) |
||||||
|
2-18 |
169 |
- |
295 |
93 |
- |
95 |
69 |
- |
71 |
|
2-19 |
174 |
- |
182 |
95 |
- |
95 |
71 |
- |
71 |
|
3-1 |
174 |
- |
191 |
94 |
- |
95 |
71 |
- |
71 |
Note: Bolded and underlined figure represents exceedance of relevant
limits stipulated in EIAO-TM and AQOs. The range of the results means the
predicted concentrations at the ASRs within the site at all assessment heights.
Table 3.47 Predicted Construction Dust Impact on Representative Existing ASRs in Year 2031 – Year 2036 (Mitigated, Tier 2 North)
|
ASR
ID |
Maximum Hourly TSP Conc. (µg/m3) |
10th Highest Daily RSP
Conc. (µg/m3) |
10th Highest Daily FSP
Conc. (µg/m3) |
||||||
|
A1002 |
174 |
- |
183 |
95 |
- |
95 |
71 |
- |
71 |
|
A1003 |
174 |
- |
175 |
95 |
- |
95 |
71 |
- |
71 |
|
A1300 |
169 |
- |
216 |
95 |
- |
98 |
70 |
- |
71 |
|
A1302 |
169 |
- |
169 |
93 |
- |
93 |
69 |
- |
69 |
|
A1303 |
169 |
- |
169 |
92 |
- |
93 |
69 |
- |
69 |
|
A1304 |
169 |
- |
193 |
92 |
- |
93 |
69 |
- |
69 |
|
A1305 |
169 |
- |
171 |
92 |
- |
93 |
69 |
- |
69 |
|
A1307 |
169 |
- |
169 |
92 |
- |
93 |
69 |
- |
69 |
Note: Bolded and underlined figure represents exceedance of relevant
limits stipulated in EIAO-TM and AQOs. The range of the results means the
predicted concentrations at the ASRs within the site at all assessment heights.
Table 3.48 Predicted Construction Dust Impact on Project Sites with Air Sensitive Use in Year 2031 – Year 2036 (Mitigated, Tier 2 West)
|
Site
/ ASR ID |
Maximum Hourly TSP Conc. (µg/m3) |
10th Highest Daily RSP
Conc. (µg/m3) |
10th Highest Daily FSP
Conc. (µg/m3) |
||||||
|
3-11 |
175 |
- |
180 |
94 |
- |
97 |
70 |
- |
73 |
|
3-13 |
174 |
- |
245 |
94 |
- |
96 |
70 |
- |
71 |
|
3-14 |
175 |
- |
592 |
94 |
- |
100 |
70 |
- |
71 |
|
3-18 |
175 |
- |
381 |
94 |
- |
96 |
70 |
- |
71 |
|
3-4 |
174 |
- |
181 |
94 |
- |
95 |
71 |
- |
71 |
|
3-5 |
174 |
- |
174 |
94 |
- |
95 |
71 |
- |
71 |
|
3-6 |
174 |
- |
174 |
94 |
- |
95 |
71 |
- |
71 |
|
3-8 |
174 |
- |
180 |
94 |
- |
97 |
71 |
- |
73 |
Note: Bolded and underlined figure represents exceedance of relevant
limits stipulated in EIAO-TM and AQOs. The range of the results means the predicted
concentrations at the ASRs within the site at all assessment heights.
Table 3.49 Predicted Construction Dust Impact on Representative Existing ASRs in Year 2031 – Year 2036 (Mitigated, Tier 2 West)
|
ASR
ID |
Maximum Hourly TSP Conc. (µg/m3) |
10th Highest Daily RSP
Conc. (µg/m3) |
10th Highest Daily FSP
Conc. (µg/m3) |
||||||
|
A602 |
175 |
- |
175 |
95 |
- |
95 |
71 |
- |
71 |
|
A603 |
189 |
- |
189 |
96 |
- |
96 |
71 |
- |
71 |
Note: Bolded and underlined figure represents exceedance of relevant limits
stipulated in EIAO-TM and AQOs. The range of the results means the predicted
concentrations at the ASRs within the site at all assessment heights.
Table 3.50 Predicted Construction Dust Impact on Project Sites with Air Sensitive Use in Year 2031 – Year 2036 (Mitigated, Tier 2 South)
|
Site
/ ASR ID |
Maximum Hourly TSP Conc. (µg/m3) |
10th Highest Daily RSP
Conc. (µg/m3) |
10th Highest Daily FSP
Conc. (µg/m3) |
||||||
|
3-43 |
175 |
- |
204 |
94 |
- |
95 |
70 |
- |
71 |
|
4-1 |
175 |
- |
178 |
94 |
- |
96 |
70 |
- |
71 |
|
4-2 |
176 |
- |
176 |
94 |
- |
95 |
70 |
- |
71 |
|
4-3 |
175 |
- |
258 |
94 |
- |
96 |
70 |
- |
71 |
|
4-6 |
175 |
- |
197 |
94 |
- |
96 |
70 |
- |
71 |
|
5-22 |
173 |
- |
259 |
92 |
- |
93 |
69 |
- |
69 |
|
5-23 |
173 |
- |
173 |
92 |
- |
92 |
69 |
- |
69 |
|
5-24 |
173 |
- |
252 |
92 |
- |
93 |
69 |
- |
69 |
Note: Bolded and underlined figure represents exceedance of relevant
limits stipulated in EIAO-TM and AQOs. The range of the results means the
predicted concentrations at the ASRs within the site at all assessment heights.
Table 3.51 Predicted Construction Dust Impact on Representative Existing ASRs in Year 2031 – Year 2036 (Mitigated, Tier 2 South)
|
ASR
ID |
Maximum Hourly TSP Conc. (µg/m3) |
10th Highest Daily RSP
Conc. (µg/m3) |
10th Highest Daily FSP
Conc. (µg/m3) |
||||||
|
A407 |
174 |
- |
178 |
92 |
- |
93 |
69 |
- |
69 |
|
A410 |
263 |
- |
281 |
94 |
- |
94 |
69 |
- |
69 |
|
A412 |
173 |
- |
173 |
92 |
- |
92 |
69 |
- |
69 |
|
A502 |
181 |
- |
181 |
92 |
- |
93 |
69 |
- |
69 |
|
A503 |
181 |
- |
181 |
93 |
- |
93 |
69 |
- |
69 |
|
A504 |
181 |
- |
181 |
93 |
- |
93 |
69 |
- |
69 |
|
A505 |
181 |
- |
181 |
92 |
- |
92 |
69 |
- |
69 |
|
A506 |
181 |
- |
181 |
92 |
- |
93 |
69 |
- |
69 |
|
A507 |
181 |
- |
181 |
92 |
- |
92 |
69 |
- |
69 |
|
A508 |
181 |
- |
181 |
92 |
- |
92 |
69 |
- |
69 |
Note: Bolded and underlined figure represents exceedance of relevant
limits stipulated in EIAO-TM and AQOs. The range of the results means the predicted
concentrations at the ASRs within the site at all assessment heights.
3.10.11 The contour plots of cumulative maximum hourly average TSP, 10th highest daily average RSP and FSP concentrations at 1.5 mAG (worst hit level) of the above Tier 2 scenarios are presented in Figures 3.40 – 3.42 for Tier 2 Central, Figures 3.46 – 3.48 for Tier 2 East, Figures 3.49 – 3.51 for Tier 2 South, Figures 3.52 – 3.54 for Tier 2 West, and Figures 3.55 –3.57 for Tier 2 North.
3.10.12 According to the above Tier 2 assessment results, ASR P606 of Site 3-14 would still exceed the criteria of hourly average TSP and daily average RSP stipulated in the EIAO-TM and AQOs, while ASR A702 would exceed the criterion of daily average RSP stipulated in the AQOs. Tier 3 assessments for these two ASRs are then conducted with reduction in active works area nearby to one-third of monthly average work. As confirmed by the Engineer, one-third of monthly average work area during any short period of time is considered practical applying for these ASRs. The predicted cumulative maximum hourly average TSP and 10th highest daily average RSP concentrations at these ASRs of Tier 3 scenario are summarised in Table 3.52 and the contour plots are illustrated in Figure 3.58 - 3.60 respectively. The results show that construction dust impact on P606 and A702 would comply with the criteria with implementation of reduced active works area nearby.
Table 3.52 Predicted Construction Dust Impact on Affected ASRs in Year 2031 – Year 2036 (Mitigated, Tier 3 Central & West)
|
ASR
ID |
Assessment Height (mAG) |
Maximum Hourly TSP Conc. (µg/m3) |
10th Highest Daily RSP Conc. (µg/m3) |
|
P606 |
1.5 |
421 |
98 |
|
5.0 |
267 |
96 |
|
|
10.0 |
175 |
96 |
|
|
20.0 |
175 |
94 |
|
|
40.0 |
175 |
94 |
|
|
80.0 |
175 |
94 |
|
|
ASR ID |
Assessment Height (mAG) |
10th Highest Daily RSP Conc. (µg/m3) |
|
|
A702 |
1.5 |
98 |
|
|
5 |
97 |
||
|
10 |
93 |
||
Note:
Bolded and underlined figure represents exceedance of relevant limits stipulated
in EIAO-TM and AQOs. The range of the results means the predicted
concentrations at the ASRs within the site at all assessment heights.
Operation Phase Air Quality
Operational Air Quality
3.10.13 With the proper planning design, no unacceptable operational air quality impact would be anticipated. As mentioned in Section 4.12.3, the future planned development layout may be designed to avoid exposing excessive traffic noise levels so as to minimise the extent of the proposed noise barriers. To determine the implications of the proposed noise barrier on air quality impact, a sensitivity test is therefore conducted for the planned ASRs which are located behind the proposed noise barriers. The model setup and detailed results of the sensitivity test are presented in Appendix 3.14. Referring to the results as presented in Appendix 3.14, the differences between the results of with and without noise barrier scenarios are negligible.
Predicted Odour Impact by Existing Chicken Farm
3.10.14 With the proper planning design, i.e. avoid the location of air sensitive uses or fresh air intake in the exceedance zone, no unacceptable odour impact from existing chicken farm is anticipated.
Predicted Cumulative Odour Impact from Expanded and Upgraded San Wai STW, New HSK STW and Planned RTS
3.10.15 With the implementation of proposed mitigation measures, the odourous sources are all enclosed and installation of the deodorising units for treatment of the vented air from these enclosed odorous sources, no unacceptable odour impact from these two STWs and the RTS would be anticipated.
Odour Impact from Sewage Pumping Stations
3.10.16 The major odour sources (wet well, inlet chamber and screen chambers) of SPSs would be located within enclosed building structures. With proper enclosure and ventilation system to divert the odour emissions to deodouriser with at least 90% odour removal efficiency for treatment before discharge to environment, the ventilation system with a slight negative pressure within the facilities and locating the exhaust outlet of the deodouriser away from the nearby ASRs as far as practicable, it is expected that odour impact could be mitigated to an acceptable level.
3.11 Evaluation of Residual Environmental Impacts
Construction Phase
3.11.1 With the implementation measures specified in the Air Pollution Control (Construction Dust) Regulation together with recommended water frequency (dust removal efficiency of 91.7%) on active work site, exposed area and unpaved road, i.e. once per hour, and limitation of size of the active work area of the work contract closest to the affected ASR to one third of monthly average work area of the work contract in Tier 3 assessment, no adverse residual impact would be expected from the construction of the Project. When there are open excavation and spoil handling works, hoarding of 3 m high should be provided along the construction site boundary adjacent to the non-construction areas such as residential, educational institutes or recreation area in use so as to minimise the dust impact.
3.11.2 The following standard dust suppression measures are also proposed to be implemented to further minimise the dust impact. They should be incorporated by the Contractor as a General Specification to control the dust nuisance throughout the construction phase:
·
Any excavated or stockpile of dusty
material should be covered entirely by impervious sheeting or sprayed with
water to maintain the entire surface wet and then removed or backfilled or
reinstated where practicable within 24 hours of the excavation or unloading;
·
Any dusty material remaining after a
stockpile is removed should be wetted with water and cleared from the surface
of roads;
·
A stockpile of dusty material should not
extend beyond the pedestrian barriers, fencing or traffic cones;
·
The load of dusty materials on a vehicle
leaving a construction site should be covered entirely by impervious sheeting
to ensure that the dusty materials do not leak from the vehicle;
·
Where practicable, vehicles washing
facilities including a high pressure water jet should be provided at every
discernible or designated vehicle exit point. The area where vehicle washing takes
place and the road section between the washing facilities and the exit point
should be paved with concrete, bituminous materials or hardcores;
·
Provision of not less than 2.4
m high hoarding from ground level along site boundary where adjoins roads, streets
or other accessible to the public except for a site entrance or exit. Good site practice shall also be adopted
by the Contractor to ensure the conditions of the hoardings are properly
maintained throughout the construction period;
·
The portion of any road leading only to
construction site that is within 30 m of a vehicle entrance or exit should be
kept clear of dusty materials;
·
Surfaces where any pneumatic or
power-driven drilling, cutting, polishing or other mechanical breaking
operation takes place should be sprayed with water or a dust suppression
chemical continuously;
·
Any area that involves demolition
activities should be sprayed with water or a dust suppression chemical
immediately prior to, during and immediately after the activities so as to maintain
the entire surface wet;
·
Where a scaffolding is erected around the
perimeter of a building under construction, effective dust screens, sheeting or
netting should be provided to enclose the scaffolding from the ground floor
level of the building, or a canopy should be provided from the first floor
level up to the highest level of the scaffolding;
·
Any skip hoist for material transport
should be totally enclosed by impervious sheeting;
·
Every stock of more than 20 bags of cement
or dry pulverised fuel ash (PFA) should be covered entirely by impervious
sheeting or placed in an area sheltered on the top and the three sides;
·
Cement or dry PFA delivered in bulk should
be stored in a closed silo fitted with an audible high level alarm which is
interlocked with the material filling line and no overfilling is allowed; and
·
Exposed earth should be properly treated
by compaction, turfing, hydroseeding, vegetation planting or sealing with
latex, vinyl, bitumen, shortcrete or other suitable surface stabiliser within
six months after the last construction activity on the construction site or
part of the construction site where the exposed earth lies.
Operation Phase
3.11.3 During the operation phase of the Project, the predicted NO2, RSP and FSP concentrations at all representative ASRs would comply with the AQOs. With the implementation of proposed mitigation measures, the predicted odour concentrations at the ASRs in the vicinity of the existing chicken farm, San Wai STW, new HSK STW and planned RTS would comply with the criterion stipulated in EIAO-TM. No adverse residual impact is expected.
3.12 Environmental Monitoring and Audit
Construction Phase
3.12.1 Environmental monitoring and audit for potential dust impacts should be conducted during the construction phase of the Project so as to check compliance with legislative requirements. Details of the monitoring and audit programme are contained in a stand-alone EM&A Manual.
Operation Phase
3.12.2 No adverse impact would be generated during the operation phase of this Project. Therefore the EM&A works related to air quality for the operational phase is considered not necessary. However, performance/compliance tests for deodourising units of the four new SPSs are recommended. The tests should be included as one of the requirements in the construction contract before the proposed SPSs in operation.
3.13 Environmental Acceptability of Schedule 2 Designated Projects
3.13.1 An application for an EP would be submitted under this EIA for DP1, DP2, DP5, DP6, DP9 and DP12 (refer to Figure 1.3 and Section 3.1.2).
New Roads (DP1, DP2, DP5, DP6 and DP12)
3.13.2
With proper implementation of
the recommended mitigation measures for construction activities (as detailed in
Sections 3.6, 3.10.1, 3.11.1 and 3.11.2 above), no
unacceptable dust impact would be resulted from the proposed roads (DP1, DP2,
DP5, DP6 and DP12). There is no
operational air quality impact of these DP roads as mentioned in Section
3.11.3.
Sewage Pumping Stations (DP9)
3.13.3 With proper implementation of the recommended mitigation measures for construction activities (as detailed in Sections 3.10.1, 3.11.1 and 3.11.2 above), and the design of four SPSs follow the mitigation measures as described in Section 3.9.10, no unacceptable construction dust and odour impacts would be resulted from the proposed SPSs (DP9).
Other DPs
3.13.4
There will be separate EIA
studies to assess the following Schedule 2 DPs (refer to Figure
1.2):
· DP3 - Construction of new West Rail HSK station (Site 4-34)
· DP4 - Potential construction of EFTS – subject to further review
· DP7 - Potential construction of a new container back-up and storage area (Site 3-1, 3-4, 3-5, 3-13 and 3-14) - subject to further review
· DP8 - Construction of new HSK STW (Site 3-26 and part of existing San Wai STW)
· DP10 – Construction of flushing water service reservoirs for reuse of reclaimed water of Tan Kwai Tsuen and Fung Kong Tsuen (Sites 3-3 and 5-40)
· DP11 - Construction of a RTS (Site 3-12)
3.13.5 The air quality impact of these Schedule 2 DPs during construction phase and operation phase will be further investigated in separate EIA studies under the EIAO. The EM&A requirements for these Schedule 2 DPs will also be provided under separate EIA studies.
3.14 Conclusion
Construction Phase
3.14.1 The potential air quality impact from the construction works of the Project would mainly relate to construction dust from excavation, material handling, spoil removal and wind erosion. With the implementation measures specified in the Air Pollution Control (Construction Dust) Regulation together with the recommended dust suppression measures, good site practices, and EM&A programme, the predicted dust impact at ASRs would comply with the hourly, daily and annual particulates criteria stipulated in the AQOs and EIAO-TM.
Operation Phase