3 Air Quality Impact
3.1 Introduction
3.1.1.1 This section presents the assessment on potential air quality impacts arising from construction and operation of the Project, which has been conducted in accordance with the criteria and guidelines as stated in Section 1 of Annex 4 and Annex 12 of the Technical Memorandum on Environmental Impact Assessment Process (EIAO-TM) as well as the requirements given in Clause 3.4.4 and Appendix B of the EIA Study Brief (No. ESB-315/2019).
3.1.1.2 The construction for the Project will tentatively commence in Q4 2023. The construction works will take approximately 5 years and the target commissioning date will be tentatively in Q3 2028.
3.1.1.3 The tentative construction work of the entire “Improvement of Lion Rock Tunnel” (hereafter refer LRT) project will be commenced in 2025 for completion by 2036. Given the far distance from LRT Shatin portal, i.e. more than 2km away, construction works of the Project would not be a cumulative issue to the tunneling work and associated works taken place at the toll plaza. As the road widening works of LRT Road at the section near Sun Tin Wai Estate/Fung Shing Court undertaking by LRT Project will commence in December 2028 while the construction of the Project will be completed in September 2028, no potential cumulative impact due to the construction of the Improvement of LRT project will be anticipated in this EIA Study. Furthermore, as the forecast traffic flow data adopted for the air quality impact assessment in the Project has already included the effect of the Improvement of LRT Project, the cumulative impact during the operation phase of the Project in association with the Improvement of LRT project is considered.
3.1.1.4 Two other potential concurrent projects, namely Widening of Tai Po Road (TPR) (Sha Tin Section) and Revitalisation of Tai Wai Nullah, have been identified. According to the CEDD website, the Widening of TPR (Sha Tin Section) Project would be completed by Q1 2023. Therefore, no cumulative construction dust impact is anticipated during construction phase of the Project. The road alignment and the traffic generated by this project has been considered in the cumulative air quality impact during operation phase.
3.1.1.5 For the Revitalisation of Tai Wai Nullah Project, the work site of “Revitalisation of Tai Wai Nullah” (hereafter called “the Nullah Project”) will be within 500 m assessment area of this Project. Its construction programme would also be overlapped with that of the Project. The most dusty construction works of the Project within the site area of overlapping with the Revitalisation of Tai Wai Nullah project would be the foundation works for the T4 viaducts and potential construction dust impact from the Nullah Project is anticipated to be limited with the proper implementation of good site practices. Nevertheless, DSD’s and CEDD’s contractors should closely liaise to avoid construction works carrying out concurrently within the same interface areas and CEDD has agreed to include this requirement in the respective works contract to ensure that the nearby ASRs would not be subject to adverse cumulative construction dust impact.
3.2 Environmental Legislation, Standards and Guidelines
3.2.1.1 The criteria for evaluating air quality impacts and the guidelines for air quality assessment are laid out in Annex 4 and Annex 12 of the EIAO-TM.
3.2.2 Air Quality Objectives & Technical Memorandum on EIA Process
3.2.2.1 The Air Pollution Control Ordinance provides the statutory authority for controlling air pollutants from a variety of sources. The Hong Kong Air Quality Objectives (AQOs), which stipulate the maximum allowable concentrations over specific periods for typical pollutants, should be met. The prevailing AQOs are listed in Table 3.1.
Table 3.1 Air Quality Objectives for Hong Kong
|
Pollutants |
Averaging Time |
Concentration Limit (µg/m3) [1] |
Number of Exceedance Allowed per Year |
|
Respirable Suspended Particulates (RSP or PM10) [2] |
24-hour |
100 |
9 |
|
Annual [4] |
50 |
N/A |
|
|
Fine Suspended Particulates (FSP or PM2.5) [3] |
24-hour |
75 |
9 |
|
Annual [4] |
35 |
N/A |
|
|
Nitrogen Dioxide (NO2) |
1-hour |
200 |
18 |
|
Annual [4] |
40 |
N/A |
|
|
Sulphur Dioxide (SO2) |
10-min |
500 |
3 |
|
24-hour |
125 |
3 |
|
|
Carbon Monoxide (CO) |
1-hour |
30,000 |
0 |
|
8-hour |
10,000 |
0 |
|
|
Photochemical Oxidants (as ozone, O3) |
8-hour |
160 |
9 |
|
Lead (Pb) |
Annual [4] |
0.5 |
NA |
Note:
[1] All measurements of the concentration of gaseous air pollutants, i.e., sulphur dioxide, nitrogen dioxide, ozone and carbon monoxide, are to be adjusted to a reference temperature of 293Kelvin and a reference pressure of 101.325 kilopascal.
[2] Suspended particulates in air with a nominal aerodynamic diameter of 10µm or smaller.
[3] Suspended particulates in air with a nominal aerodynamic diameter of 2.5µm or smaller.
[4] Arithmetic mean.
3.2.2.2 The Annex 4 of EIAO-TM stipulated that hourly Total Suspended Particulates (TSP) level should not exceed 500 µg/m3 measured at 298K and 101.325kPa (one atmosphere) for construction dust impact assessment.
3.2.2.3 Annex 4 of the EIAO-TM has also stipulated that the odour level at a sensitive receiver should not exceed 5 odour units based on an averaging time of 5 seconds for odour prediction assessment.
3.2.3 Air Pollution Control (Construction Dust) Regulation
3.2.3.1 Notifiable and regulatory works are under the control of Air Pollution Control (Construction Dust) Regulation. This Project is expected to include notifiable works (foundation and superstructure construction) and regulatory works (dusty material handling and excavation). Contractors and site agents are required to inform the Environmental Protection Department (EPD) and adopt dust reduction measures to minimize dust emission, while carrying out construction works, to the acceptable level.
3.2.4 Air Pollution Control (Non-road Mobile Machinery) (Emission) Regulation
3.2.4.1 The Air Pollution Control (Non-road Mobile Machinery) (Emission) Regulation comes into effect on 1 June 2015. Under the Regulation, Non-road mobile machinery (NRMMs), except those exempted, are required to comply with the prescribed emission standards. From 1 September 2015, all regulated machines sold or leased for use in Hong Kong must be approved or exempted with a proper label in a prescribed format issued by EPD. Starting from 1 December 2015, only approved or exempted NRMMs with a proper label are allowed to be used in specified activities and locations including construction sites. The Contractor is required to ensure the adopted machines or non-road vehicle under the Project could meet the prescribed emission standards and requirement.
3.2.5 Development Bureau Technical Circular (Works) No. 13/2020 Timely Application of Temporary Electricity and Water Supply for Public Works Contract and Wider Use of Electric Vehicles in Public Works Contracts
3.2.5.1 In response to the carbon emission reduction target as specific in the “Hong Kong Climate Action Plan 2030+”, timely provision of electricity could help reduce carbon emission arising from operation of diesel generators at the beginning of the construction works. At the detailed design stage, project team should timely apply for the temporary electricity with a target that the necessary cables laying works could be completed before the commencement of the works contract. In addition, timely provision of electricity to construction sites can facilitate the use of Electric Vehicles (EVs) in public works contracts. The Project team should specify the use of EV(s) as well as the installation of designated medium-speed charger for each EV as a standard provision at the site accommodation in each public works contract.
3.2.6 Air Pollution Control (Fuel Restriction) Regulation
3.2.6.1 The Air Pollution Control (Fuel Restriction) Regulation was enacted in 1990 and amended in 2008. The regulation imposes legal control on the type of fuels allowed for use and their sulphur contents in commercial and industrial processes. Gaseous fuel, conventional solid fuel with a sulphur content not exceeding 1% by weight or liquid fuel with a sulphur content not exceeding 0.005% by weight and a viscosity not more than 6 centistokes at 40°C, such as Ultra Low Sulphur Diesel (ULSD) are permitted to be used in commercial and industrial processes.
3.2.6.2 The Project site is located within the “Sha Tin Fuel Restriction Area” under the Air Pollution Control (Fuel Restriction) Regulations. Except for construction site or during emergency, only gaseous fuel is allowed to be used in the Sha Tin Fuel Restriction Area. For any fuel-using equipment that is used or operated in construction site or during emergency in Sha Tin Fuel Restriction Area, ULSD is practically the liquid fuel to be used.
3.2.7 Practice Note on Control of Air Pollution in Vehicle Tunnels
3.2.7.1 The Practice Note on Control of Air Pollution in Vehicle Tunnels [1] prepared by EPD provides guidelines on control of air pollution in vehicle tunnels. Guideline values on tunnel air quality are presented in Table 3.2.
Table 3.2 Tunnel Air Quality Guidelines
|
Pollutants |
Averaging Time |
Maximum Concentration |
|
|
µg/m3 [1] |
ppm |
||
|
Carbon Monoxide (CO) |
5 minutes |
115,000 |
100 |
|
Nitrogen Dioxide (NO2) |
5 minutes |
1,800 |
1 |
|
Sulphur Dioxide (SO2) |
5 minutes |
1,000 |
0.4 |
Note:
[1] Measured at 298K and 101.325kPa.
3.3 Description of Environment
3.3.1.1 The location of the proposed Trunk Road T4 is shown in Figure 3.1. It is a trunk road connecting Shing Mun Tunnel Road and Tsing Sha Highway in the northwest with Sha Tin Road in the southeast. The surrounding land uses are mainly residential, village, industrial, government, institution or community (G/IC) uses, comprehensive development area, other specified uses, and open space. The potential air pollution sources in the Study Area would be traffic emissions from the existing and planned road networks, portal, bus and minibus termini, heavy goods vehicle and coach parking sites, and industrial emissions.
3.3.1.2 The nearest EPD general air quality monitoring station is Sha Tin monitoring station. The annual average monitoring data recorded at EPD’s Sha Tin air quality monitoring station has shown steady trend of pollutants’ concentration in the past five years. The recent five years (2016 – 2020) annual average concentrations of air pollutants relevant to the Project are summarized in Table 3.3.
Table 3.3 Average Concentrations of Pollutants in the Recent Five Years (Year 2016 – 2020) at Sha Tin EPD Air Quality Monitoring Station
|
Pollutant |
Averaging Time |
AQOs (µg/m3) |
2020 |
2019 |
2018 |
2017 |
2016 |
|
|
RSP |
24-hr |
10th Highest |
100 |
54 |
60 |
65 |
72 |
66 |
|
Annual |
50 |
25 |
28 |
32 |
31 |
29 |
||
|
FSP |
24-hr |
10th Highest |
75 |
32 |
39 |
40 |
54 |
44 |
|
Annual |
35 |
15 |
17 |
19 |
21 |
20 |
||
|
NO2 |
1-hr |
19th Highest |
200 |
136 |
150 |
149 |
144 |
137 |
|
Annual |
40 |
28 |
32 |
35 |
34 |
38 |
||
|
SO2 |
10-min |
4th Highest |
500 |
31 |
27 |
76 |
53 |
67 |
|
24-hr |
4th Highest |
125 |
13 |
12 |
16 |
16 |
16 |
|
|
CO |
1-hr |
1st Highest |
30,000 |
N/A |
N/A |
N/A |
N/A |
N/A |
|
8-hr |
1st Highest |
10,000 |
N/A |
N/A |
N/A |
N/A |
N/A |
|
|
O3 |
8-hr |
10th Highest |
160 |
153 |
199 |
182 |
167 |
141 |
|
Pb |
Annual |
0.5 |
N/A |
N/A |
N/A |
N/A |
N/A |
|
Remarks:
[1] Monitoring results exceeded AQOs are shown as bold and underlined characters.
[2] Reference conditions of gaseous pollutants concentration data: 298K and 101.325 kPa.
3.3.1.3 Apart from the air quality monitoring data, EPD has released a set of background levels from “Pollutants in the Atmosphere and their Transport over Hong Kong – 2016” (PATH-2016) model. The air pollutant concentrations for the concerned grids in the Study Area as illustrated in Figure 3.1and the predicted pollutant concentrations are summarized in Table 3.4.
Table 3.4 Background Air Pollutants Concentrations in Year 2020 Extracted from the PATH-2016 Model
|
Pollutant |
Averaging Time |
AQOs (µg/m3) |
Concentrations in PATH-2016 Grid in Year 2020 (µg/m3) |
||||||||
|
(40,39) |
(40,40) |
(41,39) |
(41,40) |
(42,39) |
(42,40) |
(43,39) |
(43,40) |
||||
|
RSP [1] |
24-hr |
10th Highest |
100 |
71 |
71 |
69 |
69 |
71 |
70 |
71 |
68 |
|
Annual |
50 |
32 |
31 |
32 |
31 |
32 |
32 |
32 |
31 |
||
|
FSP [1] [2] |
24-hr |
10th Highest |
75 |
53 |
53 |
52 |
52 |
53 |
52 |
53 |
51 |
|
Annual |
35 |
23 |
22 |
23 |
22 |
23 |
22 |
23 |
22 |
||
|
NO2 |
1-hr |
19th Highest |
200 |
116 |
103 |
111 |
107 |
100 |
104 |
84 |
90 |
|
Annual |
40 |
23 |
16 |
20 |
19 |
15 |
20 |
11 |
14 |
||
Remarks:
[1] 10th highest daily and annual RSP concentration is adjusted by adding 26.5 µg/m3 and 15.6 µg/m3 respectively with reference to “Guidelines on Choice of Models and Model Parameters”. Same adjustment is applied to estimation of FSP as well.
[2] Since FSP is not available from PATH model outputs, 24-hour average FSP and annual average FSP are estimated by 0.75 x RSP and 0.71 x RSP respectively with reference to “Guidelines on the Estimation of FSP for Air Quality Assessment in Hong Kong”.
3.4 Identification of Air Sensitive Receivers
3.4.1.1 In accordance with Annex 12 of the EIAO-TM, any domestic premises, hotel, hostel, hospital, clinic, nursery, temporary housing accommodation, school, educational institution, office, factory, shop, shopping centre, place of public worship, library, court of law, sports stadium or performing arts centre are considered as air sensitive receivers (ASRs). Any other premises or place with which, in terms of duration or number of people affected, has a similar sensitivity to the air pollutants as the aforelisted premises and places is also considered to be a sensitive receiver.
3.4.1.2 In accordance with Clause 3.4.4.2 of the EIA Study Brief, the assessment area for air quality assessment should be defined by a distance of 500 m from the boundary of the Project site and the works of the Project. Illustration of the proposed assessment area is presented in Figure 3.1.
3.4.1.3 For identification of the representative ASRs within the assessment area that would likely be affected by the potential impacts from the construction and operation of the Project, a review has been conducted based on relevant available information including topographic maps, Outline Zoning Plans (OZPs) (such as OZP Plan No. S/ST/34 – Sha Tin) and other published plans in the vicinity of the Project site. The representative ASRs within the assessment area are identified and given in Table 3.5 below. Their locations are illustrated in Figure 3.2.
Table 3.5 Representative Air Sensitive Receivers in the Vicinity of the Project
|
ASR ID |
Description |
Land Use [1] |
Approximate Horizontal Distance from the Nearest Road Alignment (m) |
Assessment Height Above Ground (mAG) |
Note [2] |
|
AAG1 |
Avon Garden, Sha Tin Park Stage 1 |
Residential |
500 |
1.5 - 70 |
(A) |
|
ACC1 |
Christ College |
Educational |
30 |
1.5 - 20 |
(A) |
|
ACCS1 |
Lin Fung House |
Residential and Commercial |
40 |
1.5 - 15 |
(A) |
|
ACCS2 |
Lin Fung House |
Residential and Commercial |
45 |
1.5 - 15 |
(A) |
|
ACTC1 |
Cotton Tree Court |
Residential and Commercial |
155 |
1.5 – 80 |
(A) |
|
ADCMS1 |
Sha Tin Wai Dr. Catherine F.Woo Memorial School |
Educational |
200 |
1.5 - 30 |
(A) |
|
AEBI1 |
Hong Kong Bible Research and Education Center |
Commercial |
55 |
1.5 - 10 |
(A) |
|
AEBI2 |
Hong Kong Bible Research and Education Center |
Commercial |
105 |
1.5 - 10 |
(A) |
|
AEBI3 |
Hong Kong Bible Research and Education Center |
Commercial |
95 |
1.5 - 10 |
(A) |
|
AFSH1 |
Fu Shing House, Fung Shing Court |
Residential |
110 |
1.5 - 110 |
(A) |
|
AFYHN1 |
Fui Yiu Ha New Village |
Residential |
100 |
1.5 - 10 |
(A) |
|
AFYHN2 |
Fui Yiu Ha New Village |
Residential |
130 |
1.5 - 10 |
(A) |
|
AFYHN3 |
Fui Yiu Ha New Village |
Residential |
230 |
1.5 - 10 |
(A) |
|
AGG1 |
Block 3, Grandeur Garden |
Residential and Commercial |
310 |
1.5 - 60 |
(A) |
|
AGH1 |
Block 3, The Great Hill |
Residential |
110 |
5 - 50 |
(B) |
|
AGH2 |
House 2, The Great Hill |
Residential |
125 |
1.5 - 10 |
(A) |
|
AGW1 |
Block 3, Grandway Garden |
Residential |
385 |
1.5 - 80 |
(A) |
|
AHCH1 |
Block C, Hing Chung House, Mei Chung Court |
Residential |
165 |
1.5 - 90 |
(A) |
|
AHG1 |
Fook Siu Court, Holford Garden |
Residential |
470 |
1.5 - 80 |
(A) |
|
AHKHM1 |
Hong Kong Heritage Museum |
Cultural |
10 |
1.5 - 15 |
(A) |
|
AHKHM2 |
Hong Kong Heritage Museum |
Cultural |
20 |
1.5 - 15 |
(A) |
|
AHL1 |
Block 1, Harmony Lodge |
Residential |
55 |
5 - 15 |
(B) |
|
AHL2 |
Block 16, Harmony Lodge |
Residential |
85 |
5 - 15 |
(B) |
|
AHP1 |
Block A, Hilton Plaza |
Residential and Commercial |
130 |
1.5 - 100 |
(A) |
|
AHP2 |
Block A, Hilton Plaza |
Residential and Commercial |
115 |
1.5 - 100 |
(A) |
|
AHP3 |
Block D, Hilton Plaza |
Residential and Commercial |
85 |
1.5 - 100 |
(A) |
|
AHRCC1 |
Stewards High Rock Centre |
G/IC |
45 |
1.5 - 10 |
(A) |
|
AIC1 |
Ivy Court, New Town Plaza Phase III |
Residential and Commercial |
195 |
1.5 - 80 |
(A) |
|
AIC2 |
Ivy Court, New Town Plaza Phase III |
Residential and Commercial |
175 |
1.5 - 80 |
(A) |
|
AISSTW1 |
Island School Sha Tin Wai |
Educational |
45 |
1.5 - 20 |
(A) |
|
AJGC1 |
HK JEBN Group Centre |
Commercial |
20 |
1.5 - 30 |
(A) |
|
AKTS1 |
Kwok Tak Seng Catholic Secondary School |
Educational |
185 |
1.5 - 20 |
(A) |
|
AKWB1 |
Kwai Wai Building |
Residential and Commercial |
70 |
1.5 - 20 |
(A) |
|
ALCY1 |
Hing Yuen Terrace |
Residential |
75 |
1.5 - 10 |
(A) |
|
ALDSC1 |
The Church of Jesus Chris of the Latter-days Saint |
Place of Public Worship |
20 |
1.5 - 10 |
(A) |
|
ALJS1 |
Caritas Lok Jun School |
Educational |
105 |
1.5 - 15 |
(A) |
|
ALUT1 |
Lei Uk Tsuen |
Residential |
310 |
1.5 - 10 |
(A) |
|
ALUT2 |
Lei Uk Tsuen |
Residential |
300 |
1.5 - 10 |
(A) |
|
ALUT3 |
Lei Uk Tsuen |
Residential |
295 |
1.5 - 10 |
(A) |
|
AMFSS1 |
Caritas Institute of Community Education |
Educational |
85 |
1.5 - 30 |
(A) |
|
AMFSS2 |
Caritas Institute of Community Education |
Educational |
60 |
1.5 - 30 |
(A) |
|
AMLC1 |
Block 4, Man Lai Court |
Residential |
200 |
1.5 - 70 |
(A) |
|
AMLPS1 |
TWGHs Tsoi Wing Sing Primary School |
Educational |
70 |
1.5 - 30 |
(A) |
|
AMPC1 |
Mei Pak Court |
Residential |
395 |
1.5 - 110 |
(A) |
|
AMSC1 |
Fai Shing House, May Shing Court |
Residential |
110 |
1.5 - 110 |
(A) |
|
AMSC2 |
Fai Shing House, May Shing Court |
Residential |
145 |
1.5 - 110 |
(A) |
|
AMSL1 |
Ming Shun Lau, Jat Min Chuen |
Residential |
210 |
1.5 - 100 |
(A) |
|
AMTH1 |
Mei Tao House, Mei Lam Estate |
Residential |
140 |
1.5 - 90 |
(A) |
|
AMTH2 |
Mei Tao House, Mei Lam Estate |
Residential |
170 |
1.5 - 90 |
(A) |
|
AMWH1 |
Mei Wai House, Mei Lam Estate |
Residential |
115 |
1.5 - 110 |
(A) |
|
AMWH2 |
Mei Wai House, Mei Lam Estate |
Residential |
110 |
1.5 - 110 |
(A) |
|
AMYH1 |
Mei Yeung House, Mei Lam Estate |
Residential |
120 |
1.5 - 60 |
(A) |
|
AMYH2 |
Mei Yeung House, Mei Lam Estate |
Residential |
125 |
1.5 - 60 |
(A) |
|
AMYL1 |
Ming Yan Lau, Jat Min Estate |
Residential |
255 |
1.5 – 100 |
(A) |
|
AOTT1 |
Block 13A, On Ting Terrace |
Residential |
35 |
5 - 20 |
(B) |
|
AOTT2 |
Block 14, On Ting Terrace |
Residential |
30 |
5 - 20 |
(B) |
|
APCH1 |
Pok Chi House, Pok Hong Estate |
Residential |
65 |
1.5 - 110 |
(A) |
|
APH1 |
House 9, Peak House |
Residential |
50 |
1.5 - 10 |
(A) |
|
APMH1 |
Pok Man House, Pok Hong Estate |
Residential |
70 |
1.5 - 80 |
(A) |
|
APMH2 |
Pok Man House, Pok Hong Estate |
Residential |
70 |
1.5 - 80 |
(A) |
|
APO1 |
Block 9, Peak One |
Residential |
95 |
10 - 60 |
(B) |
|
APO2 |
Block 7, Peak One |
Residential |
145 |
10 - 60 |
(B) |
|
APOH1 |
Pok On House, Pok Hong Estate |
Residential |
35 |
1.5 - 80 |
(A) |
|
APOH2 |
Pok On House, Pok Hong Estate |
Residential |
35 |
1.5 - 80 |
(A) |
|
APRC1 |
Pineridge |
G/IC |
35 |
1.5 - 10 |
(A) |
|
APT1 |
Puguangming Temple |
Place of Public Worship |
260 |
1.5 - 10 |
(A) |
|
APTH1 |
Pok Tat House, Pok Hong Estate |
Residential |
20 |
1.5 - 80 |
(A) |
|
APY1 |
Ping Yuen |
Residential and Commercial |
110 |
1.5 - 30 |
(A) |
|
ARBS1 |
Red Box Storage |
Industrial |
10 |
1.5 - 50 |
(A) |
|
ARP1 |
Tower 2, The Riverpark |
Residential |
35 |
1.5 - 140 |
(A) |
|
ARP2 |
Tower 2, The Riverpark |
Residential |
30 |
1.5 - 140 |
(A) |
|
ARP3 |
Tower 1, The Riverpark |
Residential |
25 |
1.5 - 140 |
(A) |
|
ARP4 |
Tower 1, The Riverpark |
Residential |
25 |
1.5 - 140 |
(A) |
|
ARP5 |
Zenith Kindergarten |
Educational |
<5 |
1.5 - 5 |
(A) |
|
ASC1 |
Block 1, Scenery Court |
Residential and Commercial |
75 |
1.5 - 90 |
(A) |
|
ASC2 |
Block 1, Scenery Court |
Residential and Commercial |
60 |
1.5 - 90 |
(A) |
|
ASC3 |
Block 2, Scenery Court |
Residential and Commercial |
55 |
1.5 - 90 |
(A) |
|
ASCOE1 |
Ho Chuen House, Shui Chuen O Estate |
Residential |
65 |
1.5 - 90 |
(A) |
|
ASCW1 |
Tung Wah Group of Hospitals Sin Chu Wan Primary School |
Educational |
165 |
1.5 - 30 |
(A) |
|
ASFH1 |
Shek Fai House, Chun Shek Estate |
Residential and Commercial |
200 |
1.5 - 80 |
(A) |
|
ASGSS1 |
Sha Tin Government Secondary School |
Educational |
145 |
1.5 - 20 |
(A) |
|
ASHR1 |
Chik Tak Building |
Residential and Commercial |
80 |
1.5 - 15 |
(A) |
|
ASIB1 |
Sunking Industry Building |
Industrial |
5 |
1.5 - 50 |
(A) |
|
ASK1 |
Osprey House, Sha Kok Estate |
Residential |
335 |
1.5 - 60 |
(A) |
|
ASK2 |
Oriole House, Sha Kok Estate |
Residential |
395 |
1.5 - 60 |
(A) |
|
ASLMS1 |
Hong Kong St. Margaret's Girls' College |
Educational |
115 |
1.5 - 30 |
(A) |
|
ASMIB1 |
San Miguel Industrial Building |
Industrial |
20 |
1.5 - 60 |
(A) |
|
ASRACP1 |
SRACP Teen Guard Valley Crime Prevention Education |
G/IC |
10 |
1.5 - 5 |
(A) |
|
ASTC1 |
Sha Tin Student Health Service Centre |
G/IC |
5 |
1.5 - 10 |
(A) |
|
ASTC2 |
Sha Tin Student Health Service Centre |
G/IC |
20 |
1.5 - 10 |
(A) |
|
ASTC3 |
Sha Tin Student Health Service Centre |
G/IC |
50 |
1.5 - 10 |
(A) |
|
ASTMC1 |
Shatin Methodist College |
Educational |
175 |
1.5 - 20 |
(A) |
|
ASTP1 |
Sha Tin Park |
Recreational |
65 |
1.5 |
(A) |
|
ASTP2 |
Sha Tin Park |
Recreational |
40 |
1.5 |
(A) |
|
ASTPS1 |
Sha Tin Public School |
Educational |
310 |
1.5 - 10 |
(A) |
|
ASTT1 |
Sha Tin Tau Village |
Residential |
95 |
1.5 - 10 |
(A) |
|
ASTTNV1 |
Sha Tin Tau New Village |
Residential |
320 |
1.5 - 10 |
(A) |
|
ASTTV1 |
Sha Tin Tau Village |
Residential |
45 |
1.5 - 10 |
(A) |
|
ASTTV2 |
Sha Tin Tau Village |
Residential |
15 |
1.5 - 10 |
(A) |
|
ASTTV3 |
Sha Tin Tau Village |
Residential |
15 |
1.5 - 10 |
(A) |
|
ASTTV4 |
Sha Tin Tau Village |
Residential |
20 |
1.5 - 10 |
(A) |
|
ASTTV5 |
Sha Tin Tau Village |
Residential |
30 |
1.5 - 10 |
(A) |
|
ASTTV6 |
Sha Tin Tau Village |
Residential |
15 |
1.5 - 10 |
(A) |
|
ASTTV7 |
Sha Tin Tau Village |
Residential |
5 |
1.5 - 10 |
(A) |
|
ASTWV1 |
Sha Tin Wai Village |
Residential |
440 |
1.5 - 10 |
(A) |
|
ASYH1 |
Shek Yuk House, Chun Shek Estate |
Residential and Commercial |
135 |
1.5 - 60 |
(A) |
|
ASYH2 |
Shek Yuk House, Chun Shek Estate |
Residential and Commercial |
130 |
1.5 - 60 |
(A) |
|
ATFSR1 |
18 To Fung Shan Road |
Residential |
90 |
1.5 - 10 |
(A) |
|
ATFSR2 |
18 To Fung Shan Road |
Residential |
75 |
1.5 - 10 |
(A) |
|
ATFSR3 |
18 To Fung Shan Road |
Residential |
90 |
1.5 - 10 |
(A) |
|
ATL1 |
Tin Liu |
Residential |
170 |
1.5 - 10 |
(A) |
|
ATLWE1 |
Tung Lo Wan Village Extension |
Residential |
160 |
1.5 - 10 |
(A) |
|
ATLWE2 |
Tung Lo Wan Village Extension |
Residential |
200 |
1.5 - 10 |
(A) |
|
ATLWV1 |
Tung Lo Wan Village |
Residential |
45 |
1.5 - 10 |
(A) |
|
ATLWV2 |
Tung Lo Wan Village |
Residential |
25 |
1.5 - 10 |
(A) |
|
ATLWV3 |
Tung Lo Wan Village |
Residential |
20 |
1.5 - 10 |
(A) |
|
ATLWV4 |
Tung Lo Wan Village |
Residential |
20 |
1.5 - 10 |
(A) |
|
ATLWV5 |
Tung Lo Wan Village |
Residential |
20 |
1.5 - 10 |
(A) |
|
ATLWV6 |
Tung Lo Wan Village |
Residential |
50 |
1.5 - 10 |
(A) |
|
ATPHS1 |
Tsok Pok Hang San Tsuen |
Residential |
55 |
1.5 - 10 |
(A) |
|
ATPHS2 |
Tsok Pok Hang San Tsuen |
Residential |
50 |
1.5 - 10 |
(A) |
|
ATPHS3 |
Tsok Pok Hang San Tsuen |
Residential |
45 |
1.5 - 10 |
(A) |
|
ATSV1 |
To Shek Village |
Residential |
245 |
1.5-10 |
(A) |
|
ATTU1 |
Tsang Tai Uk |
Residential |
20 |
1.5 - 10 |
(A) |
|
ATTU2 |
Tsang Tai Uk |
Residential |
5 |
1.5 - 10 |
(A) |
|
ATTU3 |
Tsang Tai Uk |
Residential |
30 |
1.5 - 10 |
(A) |
|
ATTU4 |
Tsang Tai Uk |
Residential |
25 |
1.5 - 10 |
(A) |
|
ATTUN1 |
Tsang Tai Uk New Village |
Residential |
20 |
1.5 - 10 |
(A) |
|
ATTUP1 |
Tsang Tai Uk Playground |
Recreational |
20 |
1.5 |
(A) |
|
ATUV1 |
Tse Uk Village |
Residential |
25 |
1.5 - 10 |
(A) |
|
ATUV2 |
Tse Uk Village |
Residential |
25 |
1.5 - 10 |
(A) |
|
ATUV3 |
Tse Uk Village |
Residential |
115 |
1.5 - 10 |
(A) |
|
ATWNV1 |
Tai Wai New Village |
Residential |
490 |
1.5 - 10 |
(A) |
|
ATWNV2 |
Tai Wai New Village |
Residential |
490 |
1.5 - 10 |
(A) |
|
AVLP1 |
Block G, Villa Le Parc |
Residential |
150 |
1.5 - 10 |
(A) |
|
AVLP2 |
Block D, Villa Le Parc |
Residential |
85 |
1.5 - 10 |
(A) |
|
AVM1 |
Villa Maria |
Residential |
40 |
1.5 - 10 |
(A) |
|
AWSH1 |
Wah Shing House, Fung Shing Court |
Residential |
165 |
1.5 - 110 |
(A) |
|
AWSH2 |
Wing Shing House, Fung Shing Court |
Residential |
270 |
1.5 - 110 |
(A) |
|
AWWC1 |
Block 1, Wai Wah Centre |
Residential and Commercial |
270 |
1.5 - 90 |
(A) |
|
AWWTC1 |
Buddist Wong Wan Tin College |
Educational |
150 |
1.5 - 20 |
(A) |
|
AWWTC2 |
Buddist Wong Wan Tin College |
Educational |
80 |
1.5 - 20 |
(A) |
|
A39 |
Residential Development at Area 39 |
Residential |
215 |
1.5 - 120 |
(A) |
Remarks:
[1] ‘G/IC’ stands for Government/Institution or Community.
[2] Assumption of assessment heights:
(A) The assessment heights are taken as 1.5mAG, 5mAG, every 5m up to 20mAG, then every 10m up to the max. building height.
(B) The assessment height starts from the lowest residential floor and every 5m up to 20mAG, then every 10m up to the max. building height. There is no air sensitive use below this assessment height.
3.5 Identification of Environmental Impacts
3.5.1 Construction Phase
3.5.1.1 The construction activities dominantly contribute to construction dust impacts would be the heavy construction activities which mainly include site clearance, utilities protection and diversion works, slopework, excavation, piling and roadworks, construction of underpass/depressed road sections and wind erosion of exposed work area. Limited dust would be generated from superstructure construction, dust impact of this activity is therefore considered as negligible. The tentative typical working hours would be 07:00 to 19:00. According to the construction programme presented in Appendix 2.1, the construction works of the Project would tentatively commence in Q4 Year 2023 for completion in Q3 Year 2028. The major construction activities are shown in Appendix 3.1. The particulate impacts from the vehicular emission induced by the proposed and the existing road networks, portals, bus and minibus termini, heavy goods vehicle (including traffic included by the construction of the Project) and coach parking sites, and industrial emissions in the vicinity of the Project were included in the cumulative construction dust impact assessment.
3.5.1.2 There would be dump trucks for loading and unloading with the tentative transporting routings presented in Table 3.6. The travel distance involved would be minimized and the use of highways would be maximized as much as possible to minimize the duration of transportation. In addition, the dump trucks would be covered by clean impervious sheeting to minimize dust nuisance to the nearby ASRs, Therefore, there would be no adverse dust emission from the works area to the surrounding ASRs and adverse construction dust impact on the surrounding ASRs is not anticipated with implementation of mitigation measures stipulated in the Air Pollution Control (Construction Dust) Regulation.
Table 3.6 Tentative Transportation Routings
|
Destination |
Tentative Transportation Routing |
|
South East New Territories Landfill |
Sha Tin Wai Road, Sha Lek Highway, Tate’s Carin Tunnel, Kwun Tong Bypass, Tseung Kwan O Tunnel, Wan Po Road |
|
Tseung Kwan O Area 137 Fill Bank |
Sha Tin Wai Road, Sha Lek Highway, Tate’s Carin Tunnel, Kwun Tong Bypass, Tseung Kwan O Tunnel, Wan Po Road |
|
Chemical Waste Treatment Centre |
Tsing Sha Highway / Eagle’s Nest Tunnel and Route 8 / Stonecutters Bridge |
|
North East New Territories Landfill |
Tai Po Road (Sha Tin Section), Tolo Highway, Fanling Highway, Heung Yuen Wai Highway, Wo Keng Shan Road |
3.5.1.3 Also, the proposed Trunk Road T4 comprises of a viaduct section across the Shing Mun River Channel, which would require construction of piled foundation. The channel bed materials within the bored piles for the viaduct foundation construction would need to be excavated. The quantities of marine-based sediment to be excavated are expected to be around 800 m3. The excavation and handling of nullah bed material may cause odour impacts during construction. Given the limited channel bed materials to be excavated and with implementation of good site practice recommended in Section 3.8.1, unacceptable odour nuisance is not anticipated.
3.5.1.4 During construction phase, temporary removal of existing vertical noise barriers, cantilever noise barrier and semi-enclosure is required. The affected sections are very short (the max. length of temporary removal of noise mitigation measures is ~60m). As the direct noise mitigation measures of the affected sections will be re-provided or replaced by the proposed direct noise mitigation measures under this Project, the affected duration is expected to be limited (less than 6 months). Given the small affected sections and limited affected duration, air quality impacts associated with the temporary removal of existing direct noise mitigation measures is expected to be temporary and limited. A sensitivity test was conducted to investigate the potential air quality impact with regard to short-term AQOs (i.e. 1-hr NO2, 1-hrTSP and 24-hr RSP & FSP) and found only minor impact. Detailed methodology and results of the sensitivity test are presented in Appendix 3.17.
Identification of Key Air Pollutants of Emission from Construction Activities
3.5.1.5 The potential air quality impact during construction phase would arise from fugitive dust emissions (TSP, RSP and FSP emissions) generated mainly by heavy construction activities including site clearance, utilities protection and diversion works, slope work, excavation, piling and roadworks, construction of underpass/depressed road sections and wind erosion of exposed work area, within the Project boundary. Fuel combustion from the use of Powered Mechanical Equipment (PME) during construction works is also a source of particulates, NOx, SO2 and CO. However, the number of such equipment required on-site will be limited under normal operation. Limited smoke and gaseous emissions would be generated from equipment with proper maintenance. In addition, according to the Air Pollution Control (Non-road Mobile Machinery (NRMM)) (Emission) Regulation, starting from 1 December 2015, only approved or exempted NRMMs with a proper label are allowed to be used in specified activities and locations including construction sites. The Contractor is required to ensure the adopted machines or non-road vehicle under the Project could meet the prescribed emission standards and requirement. In addition, legal control is imposed on the types of fuels allowed for use and their sulphur contents in commercial and industrial processes under the Air Pollution Control (Fuel Restriction) Regulation. To control the exhaust emissions from construction plant and equipment, the sulphur content of liquid fuel shall not exceed 0.005%.Hence, with the implementation of the said Regulation, the emissions from PMEs are considered relatively low, no adverse air quality impact to the surrounding ASRs is expected. Thus, particulates from construction activities would be the major air pollutant during construction phase. Quantitative assessment of TSP emission impact as well as other particulates, RSP and FSP, was conducted for assessing construction dust impact due to the Project.
3.5.2 Operation Phase
3.5.2.1 Potential air quality impacts during the operation phase of the Project would be associated with the following major pollution sources.
Emission Sources within 500m Study Area
· Background pollutant concentrations;
· Vehicular emissions from the existing and proposed road networks within 500m away from the project site boundary (locations shown in Appendix 3.5);
· Portal emissions from the existing full enclosures, proposed T4 underpasses and proposed full enclosures (locations shown in Figure 3.3.1, Figure 3.3.2 & Figure 3.3.3);
· Vehicular emissions associated with the existing bus and minibus termini, heavy goods vehicle and coach parking sites (locations shown in Appendix 3.7);
· Industrial emissions from Prince of Wales Hospital (locations shown in Appendix 3.8);
Other Major Point Sources within 4km
· Industrial emissions from Fu Shan Crematorium (locations shown in Appendix 3.8); and
· Industrial emissions from Diamond Hill Crematorium (locations shown in Appendix 3.8).
Identification of Key Air Pollutants of Vehicular emissions
3.5.2.2 The Project induces vehicular emission from the open sections of the proposed road networks. Vehicular emission comprises a number of pollutants, including NOx, RSP, FSP, SO2, etc. According to “An Overview on Air Quality and Air Pollution Control in Hong Kong” published in EPD’s website, motor vehicles are the main causes of high concentrations of RSP, FSP and NOx at street level in Hong Kong and are considered as key air quality pollutants for road projects. For other pollutants, due to the low concentration in vehicular emission, they are not considered as key pollutants for the purpose of this study.
(i) Nitrogen Dioxide (NO2)
3.5.2.3 Nitrogen oxide (NOx) is a major pollutant from fossil fuel combustion. According to the 2018 Hong Kong Air Pollutant Emission Inventory Report [2] published by EPD, navigation was the dominant contributor to NOx generation in Hong Kong, accounting for 37% of NOx emission in 2018. Road transport was also a major NOx contributor which accounted for 18% of the total in the same year.
3.5.2.4 In the presence of O3 and VOC, NOx would be converted to NO2. The operation of the proposed road networks would inevitably influence the distribution of NOx emission and subsequently the roadside NO2 concentration. Hence, NO2 is one of the key pollutants for the operation air quality assessment of the Project. 1-hour and annual average NO2 concentrations at each identified ASRs would be assessed and compared with the relevant AQO to determine the compliance.
(ii) Respirable Suspended Particulates (RSP)
3.5.2.5 Respirable Suspended Particulates (RSP) refers to suspended particulates with a nominal aerodynamic diameter of 10µm or less. According to the 2018 Hong Kong Air Pollutant Emission Inventory Report 2 published by EPD, navigation is the dominant contributor to RSP generation in Hong Kong, accounting for 34% of RSP emission in Year 2018. Road transport is also a RSP contributor which accounted for 10% of the total in the same year. The operation of the proposed road networks would inevitably influence the distribution of RSP emission and subsequently the roadside RSP concentration. Hence, RSP is also one of the key pollutants for the operation air quality assessment of the Project. 24-hour and annual average RSP concentrations at each identified ASRs would be assessed and compared with the relevant AQO to determine the compliance.
(iii) Fine Suspended Particulates (FSP)
3.5.2.6 Fine Suspended Particulates (FSP) refers to suspended particulates with a nominal aerodynamic diameter of 2.5µm or less. According to the 2018 Hong Kong Air Pollutant Emission Inventory Report 2 published by EPD, navigation is the dominant contributor to RSP generation in Hong Kong, accounting for 41% of FSP emission in Year 2018. Road transport is also a FSP contributor which accounted for 12% of the total in the same year. The operation of the proposed road networks would inevitably influence the distribution of FSP emission and subsequently the roadside FSP concentration. Hence, FSP is also one of the key pollutants for the operation air quality assessment of the Project. 24-hour and annual average FSP concentrations at each identified ASRs would be assessed and compared with the relevant AQO to determine the compliance.
(iv) Sulphur Dioxide (SO2)
3.5.2.7 Sulphur Dioxide (SO2) is formed primarily from the combustion of sulphur-containing fossil fuels. In Hong Kong, navigation and public electricity generation are the major sources of SO2. SO2 emission from vehicular exhaust is due to the sulphur content in diesel oil. According to the 2018 Hong Kong Emission Inventory Report released by EPD, SO2 emissions from vehicles had been substantially reduced (<1% of total) after the introduction of Euro V diesel from December 2007, whose sulphur content are capped at 0.001%.
3.5.2.8 In addition, the measured 10-min and daily average SO2 concentration at all EPD air monitoring stations in 2020 are all less than 35% of the respective AQO. In view of the small contribution by road transport, relatively low measured concentrations and the adoption of low-sulphur and ultra-low-sulphur fuel under the existing government policy, SO2 would not be a critical air pollutant of concern.
(v) Carbon Monoxide (CO)
3.5.2.9 Carbon Monoxide (CO) is a typical pollutant emitted from fossil fuel combustion and comes mainly from vehicular emissions. With reference to the Air Quality in Hong Kong 2020 Statistical Summary [3], the highest 1-hour average (2850 µg/m3) and the highest 8-hour average (1685 µg/m3) CO concentrations were both recorded at the Causeway Bay roadside station; there values were around one tenth and one firth of the respective AQO. In view that there is still a large margin to the AQOs, CO would not be a critical air pollutant of concern.
(vi) Ozone (O3)
3.5.2.10 Ozone (O3) is produced from photochemical reaction between NOx and VOCs in the presence of sunlight, which will not be generated by this Project. Concentrations of O3 is governed by both precursors and atmospheric transport from other areas. When precursors transport under favourable meteorological conditions and sunlight, ozone will be produced. This explains why higher ozone levels are generally not produced in the urban core or industrial area but rather at some distance downwind after photochemical reactions have take place. In the presence of large amounts of NOx in the roadside environment, O3 reacts with NO to give NO2 and thus results in O3 removal. O3 is therefore not considered as a key air pollutant for the operation air quality assessment of a road project.
(vii) Lead (Pb)
3.5.2.11 Lead (Pb) is not considered as a critical air pollutant of concern. The sale of leaded petrol has been banned in Hong Kong since April 1999. According to the Air Quality in Hong Kong 2019 [4], the annual averages were ranging from 10 ng/m3 (at Central/ Western, Kwun Tong, Shum Shui Po and Tseung Kwan O) to 13 ng/m3 (at Yuen Long). The measured concentrations were well below the AQO limit of 500 ng/m3.
(viii) Toxic Air Pollutants (TAPs)
3.5.2.12 Toxic Air Pollutants (TAPs) is a type of the pollutants found in vehicular exhaust, which are known or suspected to cause cancer or other serious health and environmental effects. With reference to EPD’s Assessment of Toxic Air Pollutant Measurements in Hong Kong Final Report [5], monitored TAPs in Hong Kong include diesel particulate matters (DPM), toxic elemental species, dioxins, polychlorinated biphenyls (PCBs), polycyclic aromatic hydrocarbons (PAHs), carbonyls, volatile organic compounds (VOCs). According to the results of Assessment of Toxic Air Pollutant Measurements in Hong Kong Final Report and Sources of PCB emissions [6], vehicular emission is not considered as primary source of dioxins, PCBs, carbonyls and most toxic elemental species in Hong Kong. Therefore, these pollutants are not considered as key pollutants for quantitative assessment for the operation phase of a road project.
3.5.2.13 DPM as part of the overall RSP, is one of the most important parameters contributing to the overall health risk of the population. Local vehicular emission is one of the major sources of DPM. As recommended by EPD’s Assessment of Toxic Air Pollutant Measurements in Hong Kong Final Report, 2003, elemental carbon (EC) is used as a surrogate for DPM, and with reference to Measurements and Validation for the Twelve-month Particulate Matter Study in Hong Kong [7], 2019, EC was high in the past but reached a steady level in 2008 and showed a declining trend from 2011 to 2019. With the continual efforts by EPD to reduce particulate emission from the vehicular fleet, a discernible decreasing trend is noted in the level of particulate matter. Therefore, DPM is not selected as representative pollutant for quantitative assessment for this project.
3.5.2.14 PAHs are organic compounds of two or more fused benzene rings, in linear, angular or cluster conformations. Local vehicular traffic is also an important source of PAHs. For this group, the most important PAH is Benzo[a]pyrene, and it is often selected as a marker for the PAHs. The European Union (EU) Air Quality Standards for PAHs (expressed as concentration of Benzo[a]pyrene) is 1 ng/m3 for annual average[8]. With reference Air Quality in Hong Kong 2019, annual average concentrations of PAHs (Benzo[a]pyrene) measured at EPD’s TAP monitoring stations (Tsuen Wan and Central/Western) were 0.02 ng/m3 and 0.03 ng/m3, which is far below the EU standards. Thus, PAHs are not considered as key pollutants for quantitative assessment for this Project.
3.5.2.15 VOCs are of great concern due to the important role played by them in a range of health and environmental problems. The US Environmental Protection Agency (USEPA) has designated many VOC, including those typically found in vehicular emission, as air toxics. According to Assessment of Toxic Air Pollutant Measurements in Hong Kong Final Report, among the VOC compounds, benzene and 1,3-butadiene are the most significant ones for Hong Kong. The UK Air Quality Standards for Benzene and 1,3-butadiene are 5.0 µg/m3 and 2.25 µg/m3 respectively[9]. According to Air Quality in Hong Kong 2019, annual average concentrations of benzene at EPD’s TAP monitoring stations were 1.03 µg/m3 (Tsuen Wan) – 1.08 µg/m3 (Central/Western). The levels of 1,3-butadiene were 0.06 µg/m3 and 0.04 µg/m3 for Tsuen Wan and Central/Western respectively. They are far below the UK Standards. Thus, VOCs are not considered as key pollutants for quantitative assessment for this Project.
3.5.2.16
3.6 Assessment Methodology
3.6.1 Construction Phase
Emission Inventory
Construction Dust from the Project
3.6.1.1 Construction activities with significant particulate emission were identified from the construction method according to engineering design. Construction dust impact was predicted based on emission factors from US Environmental Protection Agency (USEPA) Compilation of Air Pollution Emission Factors (AP-42), 5th edition [10] and activity information from the engineer design. The major dusty construction activities for the Project to be concerned and considered in the modelling assessment include site clearance, utilities protection and diversion works, slopework, excavation, piling and roadworks and construction of underpass/depressed road sections as heavy construction activities during working hours. Wind erosion of exposed work area was considered during non-working hours. Work areas with dusty construction activities for the Project (i.e. site clearance, utilities protection and diversion works, slopework, excavation, piling and roadworks and construction of underpass/depressed road sections) are identified and their locations are shown in Appendix 3.1. The remaining areas within the site boundary are not considered in the modelling assessment as there is no dusty construction activities. Precast concrete construction method will be adopted for bridge deck construction, limited dust would be generated. Stockpiling area, material handling area or other areas with dusty activities would be confined within the dusty heavy construction work areas.
3.6.1.2 The emission factors for identified dust sources are summarized in Table 3.7. The detailed calculation of dust emission rates is presented in Appendix 3.1.
Table 3.7 Emission Factor for Dusty Construction Activities
|
Emission Source |
Activity |
Emission Factor |
Remarks |
|
Site clearance, utilities protection and diversion works, slopework, excavation, piling and roadworks and construction of underpass/depressed road sections |
Heavy Construction Activities |
E(TSP) = 2.69 Mg/hectare/month of activity
E(RSP) = 2.69 x 47.3% [1] Mg/hectare/month of activity
E(FSP) = 2.69 x 7.2% [1] Mg/hectare/month of activity |
Ref. from AP-42, Section 13.2.3, 1/95 ed. |
|
Wind Erosion |
E(TSP) = 0.85 Mg/hectare/year
E(RSP) = 0.85 x 47.3% [1] Mg/hectare/year
E(FSP) = 0.85 x 7.2% [1] Mg/hectare/year |
Ref. from AP-42, Section 11.9, 10/98 ed., Table 11.9-4 |
Remark:
[1] Reference from USEPA AP-42, 5th ed. 11/06 ed 10. Section 13.2.4 and further discussed in Section 3.6.1.3 below.
3.6.1.3 Construction dust emission factors in USEPA AP-4210 are expressed in terms of TSP. Fractions of finer particulates are to be estimated from the TSP emission which requires the size distribution information of the concerned process, in order to compare against the AQOs. The particle size distributions of aggregate handling which is considered to be equivalent to general construction processes are available in AP-42 by USEPA10. Particle size distributions of aggregate handling are listed in Table 3.8. Construction dust emission inventory in RSP and FSP were estimated by applying the factors of associated process to TSP emission. The emission rates in TSP, RSP and FSP of each dust source and their respective locations are presented in Appendix 3.1.
Table 3.8 Particle Size Distribution
|
Process |
Cumulative % of TSP |
||
|
RSP |
FSP |
Reference |
|
|
Aggregate Handling (equivalent to Heavy Construction Activities) |
47.3% |
7.2% |
Page 13.2.4-4, Section 13.2.4, AP-42, USEPA (Version 11/06) |
3.6.1.4 For the prediction of the maximum hourly average TSP, the 10th highest daily average and annual average RSP and FSP concentrations, 12-hour (07:00-19:00) per day, 7 days a week was assumed for the construction period in the assessment. Only wind erosion was assumed for other non-working hours (19:00 to 07:00 of the following day).
3.6.1.5 In order to minimize the construction dust impact, the following dust mitigation measures shall be implemented:
· Watering once every two hours on heavy construction work areas to reduce dust emission by 91.7%. Detailed calculation of the dust suppression efficiency is presented in Appendix 3.1. Any potential dust impact and watering mitigation would be subject to the actual site condition. For example, a construction activity that produces inherently wet conditions or in cases under rainy weather, the above water application intensity may not be unreservedly applied. While the above watering frequency is to be followed, the extent of watering may vary depending on actual site conditions but should be sufficient to achieve the removal efficiency. The dust levels would be monitored and managed under an Environmental Monitoring and Audit (EM&A) programme as specified in the EM&A Manual.
Vehicular Emissions from Open Roads, Portals, Bus and Minibus Termini, Heavy Goods Vehicle and Coach Parking Sites, and Industrial Emissions
3.6.1.6 Emission from the vehicular emissions from open roads (including traffic included by the construction of the Project), portals from existing full enclosures, bus and minibus termini, heavy goods vehicle and coach parking sites, and industrial emissions from Prince of Wales Hospital (PWH), Fu Shan Crematorium (FSC) and Diamond Hill Crematorium (DHC) in the vicinity of the Project were considered in the cumulative impact assessment.
3.6.1.7 The details of the emission inventories of these vehicular and industrial emission sources refer to Section 3.6.2.1 to Section 3.6.2.12.
Background Contributions
3.6.1.8 The background contributions for construction phase follows the same approach as stated for operation phase (refer to Section 3.6.2.13 to Section 3.6.2.15). Year 2020 is the best available data in PATH-2016 model for estimating the background pollutant concentrations during construction phase.
Determination of the Assessment Year
3.6.1.9 Referring to the construction programme as presented in Appendix 2.1, the construction period would tentatively commence in 2023 for completion in 2028. The vehicular emission burdens of TSP, RSP and FSP during construction phase in Year 2023, 2025 and 2028, were estimated by using EMFAC-HK and are shown in Appendix 3.3. The vehicular emission attained the highest in Year 2023. Therefore, Year 2023 was therefore selected as the assessment year.
Dispersion Modelling & Modelling Approach
Emission from Construction Activities, Vehicular Emissions from Portals, Bus and Minibus Termini, Heavy Goods Vehicle and Coach Parking Sites, and Industrial Emissions
3.6.1.10 AERMOD, the EPD approved air dispersion model, was employed to predict the air quality impact due to the emissions from construction activities, vehicular emissions from portals, bus and minibus termini, heavy goods vehicle and coach parking sites, and industrial emissions at the representative ASRs.
3.6.1.11 Construction dust sources and wind erosion were modelled as “AREAPOLY” sources and were assumed operating during working hours (07:00 – 19:00) and non-working hours respectively.
3.6.1.12 The other vehicular and industrial emission sources were modelled as “POINT”, “AREA”, “AREAPOLY” and “VOLUME” sources. The daily profiles adopted in AERMOD were based on the available information.
3.6.1.13 Hourly meteorological conditions including wind data, temperature, relative humidity, pressure cloud cover and mixing height of Year 2010 were extracted from the WRF meteorological data adopted in the PATH-2016 system. The minimum wind speed was capped at 1 metre per second. The mixing height was capped between 121 metres and 1667 metres according to the observation in Year 2010 by Hong Kong Observatory (HKO). The height of the input data was assumed to be 9 metres above ground for the first layer of the WRF data as input. In order to avoid any missing hours misidentified by AERMOD and its associated components, the WRF met data was handled manually to set wind direction between 0° – 0.1° to be 360°. The meteorological data was inputted as on-site data into AERMET.
3.6.1.14 Surface characteristic parameters such as albedo, Bowen ratio and surface roughness are required in the AERMET (the meteorological pre-processor of AERMOD). The land use characteristics of the surrounding are classified and these parameters of each land use are then suggested by AERMET by default according to its land use characteristics. The detailed assumptions are discussed in Appendix 3.10. Flat terrain and urban mode in AERMOD were adopted for this assessment.
3.6.1.15 Dry deposition was applied in the model run for particulates when appropriate. Particle size distribution was also assigned for particles with aerodynamic diameters smaller than 10 µm to each type of sources in the AERMOD in order to account for the particle deposition. As described in Table 3.7, the construction dust sources are divided into two types, heavy construction activities and wind erosion. The particle size distributions for these sources are summarized in Table 3.9.
Table 3.9 Particle Size Distribution of Aggregate Handling (Equivalent to Heavy Construction Activities and Wind Erosion)
|
Average Particle Diameter (µm) |
Normalized Distribution |
|
1.25 |
7% |
|
3.75 |
20% |
|
7.5 |
20% |
|
12.5 |
18% |
|
22.5 |
35% |
Remark:
[1] Reference from Table of Aerodynamic Particle Size Multiplier (k) for Equation 1, Section 13.2.4-4, AP-42, USEPA.
Vehicular Emissions from Open Roads
3.6.1.16 CALINE4, the EPD approved line source air dispersion model developed by the California Department of Transport was used to assess the contribution due to vehicular emissions from the roads within 500m assessment area. Detailed discussion of the CALINE4 modelling approach is provided in Section 3.6.2.17 to Section 3.6.2.18.
Cumulative Air Quality Impact
3.6.1.17 The cumulative air quality impact for construction phase follows the same approach as stated for operation phase (refer to Section 3.6.2.26 to Section 3.6.2.28).
3.6.2 Operation Phase
Vehicular Emissions from Open Roads
3.6.2.1 Open section of existing and planned road networks within 500m Study Area of the Project were identified. The predicted 24-hour traffic flow and vehicle compositions at the identified roads during operation phase provided by the traffic consultant were adopted to assess the potential air quality impact from the open roads. The traffic data adopted for the assessment is presented in Appendix 3.2. Transport Department has no comment on the use of the traffic forecast for this Study and the endorsement letter is also attached in Appendix 3.2.
3.6.2.2 EMFAC-HK v4.2 model was adopted to estimate the vehicular emission rates of NO, NO2, TSP, RSP and FSP. The “vehicle fleet” refers to all motor vehicles operating on roads within this assessment area. The modelled fleet is broken down into 16 vehicle classes based on the information in the Appendix 1 of Guideline on Modelling Vehicle Emissions published by EPD. The detailed input parameters and model assumptions made in EMFAC-HK model are summarized in Appendix 3.3.
3.6.2.3 The vehicular emission burdens of NOx and RSP from commencement year to 15 years after, namely Year 2028, 2035 and 2043, were estimated by using EMFAC-HK and are shown in Appendix 3.3. The vehicular emission attained the highest in Year 2028 and a decreasing trend was predicted in 15 years after project commencement. Year 2028 was therefore selected as the assessment year.
3.6.2.4 The NO, NO2, RSP, FSP and TSP running exhaust and start emission factors of 16 vehicle classes predicted by EMFAC-HK are presented in Appendix 3.4. The 24-hour traffic flows and composite emission factors for each road link adopted in the subsequent air dispersion modelling are presented in Appendix 3.5.
3.6.2.5 Secondary air quality impacts arising from the implementation of existing and proposed roadside noise mitigation measures, namely, vertical noise barriers, vertical noise barriers with canopies and semi-enclosure were incorporated into the air quality model. The proposed direct noise mitigation measures are presented in Figure 4.3.1, Figure 4.3.2, Figure 4.3.3, Figure 4.3.4 and Appendix 3.6 summarised the existing and proposed roadside noise mitigation measures.
3.6.2.6 It is assumed that, with the installation of vertical noise barriers, all traffic pollutants generated from the mitigated road section are emitted from the top of the noise barriers. In the CALINE4 model, elevation of the mitigated road section was set to the elevation of the barrier top.
3.6.2.7 For vertical noise barriers with canopies and semi-enclosure, it is assumed that dispersion of traffic pollutants is in effect similar to physically shifting the mitigated road section towards the central divider. The traffic pollutants are assumed to emit from the top of the canopies. In the CALINE4 model, the alignment of the mitigated road section was shifted by a distance equal to the covered extent, elevation of the mitigated road section was set to the elevation of the barrier top.
Portal Emissions from Existing Full-Enclosures, Proposed T4 Underpasses and Proposed Full-Enclosures
3.6.2.8 The portal emissions from the existing full-enclosures, proposed T4 underpasses and proposed full-enclosures (initial NO, initial NO2, RSP, FSP and TSP) were calculated based on the vehicular emission factors predicted by EMFAC-HK model and 24-hour vehicle flows provided by the traffic consultant. The locations and detailed calculations of the emissions are presented in Figure 3.3.1, Figure 3.3.2, Figure 3.3.3 & Appendix 3.6, respectively.
3.6.2.9 Portal emissions were modelled in accordance with the Permanent International Association of Road Congress Report [11]. Pollutants were assumed to eject from the portal as a portal jet such that 2/3 of the total emissions were dispersed within the first 50 m of the portal and 1/3 of the total emissions within the second 50 m.
Vehicular Emissions Associated with Bus and Minibus Termini, Heavy Goods Vehicle and Coach Parking Sites
3.6.2.10 Despite the inclusion of start emissions on local and rural roads for most of the vehicle classes except franchised buses, public light buses, heavy goods vehicles and coach as detailed in Appendix 3.3, start emissions induced by the identified bus and minibus termini, heavy goods vehicle and coach parking sites were further simulated to avoid any underestimation of air quality impact at the exit of the termini and parking sites. The start emissions, running exhaust emissions and idling emissions associated with the vehicles at the existing bus and minibus termini, heavy goods vehicle and coach parking sites within the assessment area (initial NO, initial NO2, RSP, FSP and TSP) were calculated based on the start emission and running exhaust emission factors predicted by EMFAC-HK model, cold idling emission factors from the Calculation of Start Emissions in Air Quality Impact Assessment [12] published by EPD, warm idling emission factors from Road Tunnels: Vehicle Emissions and Air Demand for Ventilation published by World Road Association [13] and traffic data provided by the traffic consultant.
3.6.2.11 Calculations of emissions associated with the bus and minibus termini, heavy goods vehicle and coach parking sites were referenced to the Calculation of Start Emissions in Air Quality Impact Assessment 12 published by EPD. Start emissions for diesel vehicles fitted with selective catalytic reduction (SCR) devices vehicles were adjusted based on the idling emission and would be released over a total spread distance of 700 m from where the start takes place, start emissions for liquefied petroleum gas (LPG) minibus were adjusted based on the idling emission and would be released over a total spread distance of 150m from where the start takes place, while running exhaust and idling emissions would be released on the spot. For identified terminus and parking sites, running exhaust and idling emissions from terminating and non-terminating vehicles, and adjusted start emission from terminating vehicles are considered for emissions inside terminus/ parking sites while the remaining adjusted start emission from terminating vehicles is considered for emissions outside terminus/ parking sites. The locations of emission sources and the detailed calculation of the emissions are presented in Appendix 3.7. Transport Department has no comments on the methodology in deriving the in and out traffic pattern of GMB / franchised bus at PTIs / termini, and the endorsement letter is also attached in Appendix 3.7.
Industrial Emissions from Prince of Wales Hospital, Fu Shan Crematorium and Diamond Hill Crematorium
3.6.2.12 Chimneys within the study area and 4km area from the study area from Specific Process (SP) and non-SP have been identified at the PWH, FSC and DHC. Emissions from these identified chimneys were included in the assessment. For SP operation (i.e. FSC and DHC), the parameters and emission data of the emission points were extracted from the SP licenses to develop the emission inventory. For non-SP operation (i.e. PWH), the parameters of the emission points as well as the fuel consumption were provided by PWH, while the NOx emissions were calculated with reference to the approved Housing Sites in Yuen Long South EIA Report [14], which further referred to the approved Provision of a Poultry Slaughtering Centre in Sheung Shui EIA Report [15]. The particulate emissions are calculated based on emission factors from USEPA AP-42 10. The locations of emission sources and the detailed calculation of the emissions are presented in Appendix 3.8.
Background Contributions
3.6.2.13 As suggested by “Guidelines on Assessing the ‘TOTAL’ Air Quality Impacts”, an integrated modelling system, Pollutants in the Atmosphere and their Transport over Hong Kong model (PATH-2016) which is developed and maintained by EPD was applied to estimate the background pollutant concentrations including those in Pearl River Delta Economic Zone, roads, marine, airport, power plants and industries within Hong Kong.
3.6.2.14 The Study Area covers 8 grid cells of PATH-2016, namely grid (40,39), (40,40), (41,39), (41,40), (42,39), (42,40), (43,39) and (43,40). The proposed works will be completed and commence operation in Year 2028. As Year 2020 is the closest available year in PATH-2016 data currently, PATH-2016 data for Year 2020 of these 8 grid cells were adopted as the background concentration for the assessment.
3.6.2.15 To avoid double counting, the vehicular emissions (from open roads and portals) simulated with CALINE4 and AERMOD were removed from the emission inventory of PATH-2016 model. The detailed emission removal for PATH re-run is presented in Appendix 3.9.
Determination of the Assessment Scenarios
3.6.2.16 In order to calculate the air quality implication arising from the proposed road works as well as the proposed Direct Noise Remedies (DNR) as described in Section 3.6.2.5, three Scenarios as described below have been assessed at the representative ASRs.
· With Project (With DNR) Scenario – Scenario with the proposed road works presented in Section 1 of this EIA report and implementation of the proposed direct technical noise remedies.
· With Project (Without DNR) Scenario – Scenario with the proposed road works presented in Section 1 of this EIA report and without implementation of the proposed direct technical noise remedies.
· Without Project Scenario – Scenario without the proposed road works presented in Section 1 of this EIA report.
Dispersion Modelling & Modelling Approach
Vehicular Emissions from Open Roads
3.6.2.17 CALINE4, the EPD approved line source air dispersion model developed by the California Department of Transport was used to assess the contribution due to vehicular emissions from the roads within 500m assessment area. The surface roughness coefficient of each grid in each assessment scenario is 100cm, which is the typical value for new development areas advised in “Guidelines on Choice of Models and Model Parameters” by EPD.
3.6.2.18 Under the current EPD guideline, the hourly meteorological data including wind speed, wind direction, and air temperature from the relevant grids from the WRF Meteorological data (same basis for PATH-2016 model), were employed for the model run. PCRAMMET was applied to generate Pasquill-Gifford stability class for the meteorological input to CALINE4 model based on the WRF meteorological data.
Portal Emissions, Emissions Associated with Bus and Minibus Termini, Heavy Goods Vehicle and Coach Parking Sites, and Industrial Emissions
3.6.2.19 AERMOD, the EPD approved air dispersion model, was employed to predict the air quality impact due to the vehicular emissions from the portals, bus and minibus termini, heavy goods vehicle and coach parking sites, and industrial emissions at the representative ASRs.
3.6.2.20 Vehicular emission sources and industrial emission sources were modelled as “POINT”, “AREA”, “AREAPOLY” and “VOLUME” sources. The daily profiles adopted in AERMOD were based on the available information.
3.6.2.21 Hourly meteorological conditions including wind data, temperature, relative humidity, pressure cloud cover and mixing height of Year 2010 were extracted from the WRF meteorological data adopted in the PATH-2016 system. The minimum wind speed was capped at 1 metre per second. The mixing height was capped between 121 metres and 1667 metres according to the observation in Year 2010 by Hong Kong Observatory (HKO). The height of the input data was assumed to be 9 metres above ground for the first layer of the WRF data as input. In order to avoid any missing hours misidentified by AERMOD and its associated components, the WRF met data was handled manually to set wind direction between 0° – 0.1° to be 360°. The meteorological data was inputted as on-site data into AERMET.
3.6.2.22 Surface characteristic parameters such as albedo, Bowen ratio and surface roughness are required in the AERMET (the meteorological pre-processor of AERMOD). The land use characteristics of the surrounding are classified and these parameters of each land use are then suggested by AERMET by default according to its land use characteristics. The detailed assumptions are discussed in Appendix 3.10. Flat terrain and urban mode in AERMOD were adopted for this assessment.
Ozone Limiting Method for Short-term Cumulative NO2 Assessment
3.6.2.23 For the short-term cumulative NO2 assessment (i.e. predictions of hourly average NO2 concentration), Ozone Limiting Method (OLM) was adopted for conversion of NO from vehicle-related source (i.e. emissions from open roads, portals, bus and minibus termini, heavy goods vehicle and coach parking sites) and NOx from industrial sources to NO2 based on the predicted O3 level from PATH-2016. With reference to the approved Reprovisioning of Diamond Hill Crematorium EIA Report [16], the initial NO2/NOx ratios for industrial emissions from DHC were assumed as 20%. For the industrial emissions from PWH, the initial NO2/NOx ratios were assumed as 10% according to the Heathrow Airport EIA Report [17]. The predicted initial NO concentrations from open roads (from CALINE4), portals, bus and minibus termini, heavy goods vehicle and coach parking sites, 80% of the predicted NOx concentrations from DHC emissions and 90% of the predicted NOx concentrations from PWH emissions (from AERMOD) were firstly added together on an hour-to-hour basis and OLM was applied subsequently. The NO2/NOx conversion was calculated as follows:
[NO2]predicted = [NO2]vehicular + 0.2 ´ [NOx]DHC + 0.1 ´ [NOx]PWH + MIN {[NO]vehicular + 0.8 ´ [NOx]DHC + 0.9 ´ [NOx]PWH, or (46/48) ´ [O3]PATH}
where
[NO2]predicted is the predicted NO2 concentration
[NO2]vehicular is the sum of predicted initial NO2 concentration from open roads, portals, bus and minibus termini, heavy goods vehicle and coach parking sites
[NO]vehicular is the sum of predicted initial NO concentration from open roads, portals, bus and minibus termini, heavy goods vehicle and coach parking sites
[NOx]DHC is the initial NOx concentration from Diamond Hill Crematorium
[NOx]PWH is the initial NOx concentration from Prince of Wales of Hospital
MIN means the minimum of the two values within the brackets
[O3]PATH is the representative O3 PATH concentration (from other contribution)
(46/48) is the molecular weight of NO2 divided by the molecular weight of O3
Jenkin Method for Long-term Cumulative NO2 Assessment
3.6.2.24 For the long-term cumulative NO2 assessment (i.e. predictions of annual average NO2 concentration), Jenkin method was adopted for the conversion of cumulative NOx to NO2 by using the functional form of annual mean of NO2-to-NOx with reference to the Review of Methods for NO to NO2 Conversion in plumes at short ranges[18]. The mentioned functional form is referenced from Jenkin, 2004a[19] and is presented as follows:
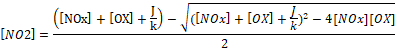
where
[NO2] is the NO2 concentration
[NOx] is the NOx concentration
[OX] is the sum of NO2 concentration and O3 concentration (i.e. [OX] = [NO2] + [O3])
J is the photolysis rate of NO2
k is the rate coefficient for reaction between NO and O3
3.6.2.25 The above functional form was used to analyse the annual mean data obtained from EPD’s air quality monitoring stations including Sha Tin general station, Tap Mun general station and three roadside stations (i.e. Causeway Bay, Central and Mong Kok roadside stations). The Sha Tin general station is the nearest station and therefore chosen as the representative station. Tap Mun general station and three roadside stations are also included in order to cover a wider range of NOx concentration. The data analyse and derivation of cumulative annual average NOx to NO2 conversion equation using Jenkin Method for this assessment are shown in Appendix 3.11. Scattered plot for recent 5 years annual means of NO2 versus NOx obtained from relevant air quality monitoring stations was created. The functional form curve would fit the annual mean data when [OX] = 106.2 µg/m3 and J/k = 17.3 µg/m3. The value of [OX] and J/k are considered reasonable as they are within typical value range for Hong Kong. The range of annual average [OX] from the selected air quality monitoring stations is 80 – 116 µg/m3. The obtained functional form curve was adopted for the cumulative annual average NOx to NO2 conversion. As shown in Appendix 3.11, the curve is slightly higher than all the annual mean data obtained from air quality monitoring stations, underestimation of the annual average NO2 concentration is not expected. The cumulative annual average NOx to NO2 conversion equation for this assessment was calculated as follows:
![]()
where
[NO2] c is the predicted cumulative NO2 concentration
[NOx] c is the predicted cumulative NOx concentration
Cumulative Air Quality Impact
3.6.2.26 The PATH-2016 model output was added to the sum of the CALINE4 and AERMOD model results sequentially on an hour-to-hour basis to derive the short-term and long-term cumulative impacts at the ASRs.
3.6.2.27 With reference to the EPD’s Guidelines on Choice of Models and Model Parameters, PATH-2016’s output of RSP concentrations are adjusted as follows:
· 10th highest daily RSP concentration: add 26.5 µg/m3
· Annual RSP concentration: add 15.6 µg/m3
3.6.2.28 With reference to the EPD’s Guidelines on the Estimation of PM2.5 for Air Quality Assessment in Hong Kong, the following conservative formulae were adopted to calculate background FSP concentration from the RSP concentration extracted from PATH-2016 model:
· Annual (µg/m3): PM2.5 = 0.71 × PM10
· Daily (µg/m3): PM2.5 = 0.75 × PM10
Vehicular Emissions Impact Inside the Proposed T4 Underpasses and Proposed Full Enclosures
3.6.2.29 It is the responsibility of the Applicant to ensure that the air quality inside the proposed underpasses and full enclosures shall comply with EPD’s “Practice Note on Control of Air Pollution in Vehicle Tunnels”. The NO2, CO and SO2 concentrations inside the proposed underpasses and full enclosures should comply with the Tunnel Air Quality Guidelines . Ventilation system will be provided for the proposed structures and will be operate 24-hour. Air Quality inside the proposed structures is to be monitored and the ventilation system is designed to be sufficient to cope with the maximum air pollution emission rate so that air quality inside will comply with the Tunnel Air Quality Guidelines.
3.7 Prediction and Evaluation of Environmental Impacts
3.7.1 Construction Phase
3.7.1.1 The cumulative air quality impacts due to background pollutant concentrations, heavy construction activities and vehicular emissions from open roads, portals from existing full enclosures, bus and minibus termini, heavy goods vehicle and coach parking sites, and industrial emissions in the vicinity of the Project at the representative ASRs have been evaluated. The predicted cumulative dust impacts are summarized in Table 3.10. The detailed assessment results and the Project Contributions are presented in Appendix 3.13.
Table 3.10 Predicted Cumulative Dust Impacts
|
ASR |
TSP Concentration (µg/m3) |
RSP Concentration (µg/m3) |
FSP Concentration (µg/m3) |
||
|
1st Highest Hourly Average |
10th Highest Daily Average |
Annual Average |
10th Highest Daily Average |
Annual Average |
|
|
EIAO-TM / AQO |
500 |
100 |
50 |
75 |
35 |
|
AAG1 |
189 |
70-71 |
32 |
52-53 |
23 |
|
ACC1 |
194-208 |
71-75 |
33-38 |
53 |
23-24 |
|
ACCS1 |
186-187 |
71-72 |
33 |
53 |
23-24 |
|
ACCS2 |
186-187 |
71-72 |
33 |
53 |
23-24 |
|
ACTC1 |
194 |
69-70 |
31-32 |
52 |
22-23 |
|
ADCMS1 |
194 |
71-72 |
33-34 |
53 |
23-24 |
|
AEBI1 |
186 |
70-71 |
33-34 |
52-53 |
23 |
|
AEBI2 |
186 |
70 |
33 |
52 |
23 |
|
AEBI3 |
186 |
70-71 |
33-34 |
52-53 |
23 |
|
AFSH1 |
194-195 |
71-74 |
32-34 |
53-54 |
23 |
|
AFYHN1 |
194 |
71 |
33 |
54 |
23-24 |
|
AFYHN2 |
194 |
71 |
33 |
53 |
23 |
|
AFYHN3 |
194 |
71 |
33 |
54 |
23 |
|
AGG1 |
202 |
71-72 |
32-33 |
53-54 |
23-24 |
|
AGH1 |
194 |
69 |
31-32 |
52 |
22-23 |
|
AGH2 |
194 |
69 |
32 |
52 |
23 |
|
AGW1 |
202 |
71-72 |
32-33 |
53-54 |
23 |
|
AHCH1 |
215 |
71 |
31-32 |
53 |
22-23 |
|
AHG1 |
202-203 |
71-72 |
32-33 |
53-54 |
23-24 |
|
AHKHM1 |
194-286 |
71-90 |
32-44 |
53-56 |
23-25 |
|
AHKHM2 |
194-197 |
70-75 |
32-35 |
52-53 |
22-23 |
|
AHL1 |
194 |
70 |
32 |
52 |
23 |
|
AHL2 |
194 |
69-70 |
32 |
52 |
23 |
|
AHP1 |
194 |
69-70 |
31-32 |
52 |
22-23 |
|
AHP2 |
194 |
69-70 |
31-32 |
52 |
22-23 |
|
AHP3 |
194 |
69-70 |
31-32 |
52 |
22-23 |
|
AHRCC1 |
187-194 |
76-79 |
36-38 |
53-54 |
23-24 |
|
AIC1 |
194 |
69 |
31-32 |
52 |
22-23 |
|
AIC2 |
194 |
69 |
31-32 |
52 |
22-23 |
|
AJGC1 |
186-187 |
70-72 |
32-33 |
52-53 |
23 |
|
AKTS1 |
187-188 |
71-73 |
33-34 |
52-53 |
23 |
|
AKWB1 |
202-203 |
71-73 |
33-34 |
54-55 |
23-24 |
|
ALJS1 |
187 |
71 |
33 |
53 |
23 |
|
ALCY1 |
194 |
70 |
32 |
53 |
23 |
|
ALDSC1 |
194 |
70 |
32-33 |
52-53 |
23 |
|
ALUT1 |
187 |
71-72 |
33 |
53 |
23 |
|
ALUT2 |
187 |
71-72 |
33 |
53 |
23 |
|
ALUT3 |
187 |
72 |
33 |
53 |
23 |
|
AISSTW1 |
194 |
71-74 |
33-37 |
53 |
23-24 |
|
AMFSS1 |
186-188 |
70-72 |
32-33 |
52-53 |
23 |
|
AMFSS2 |
194-195 |
70-72 |
32-33 |
52-53 |
22-23 |
|
AMLC1 |
186-187 |
69-71 |
32-33 |
52-53 |
23 |
|
AMLPS1 |
215 |
71-72 |
32 |
53 |
22-23 |
|
AMPC1 |
215 |
71 |
31-32 |
53 |
22-23 |
|
AMSC1 |
215-216 |
71-74 |
31-34 |
53-54 |
22-23 |
|
AMSC2 |
215-216 |
71-73 |
31-33 |
53-54 |
22-23 |
|
AMSL1 |
194 |
71 |
32-34 |
53 |
23 |
|
AMTH1 |
215 |
71 |
31-32 |
53 |
22-23 |
|
AMTH2 |
215 |
71 |
31-32 |
53 |
22-23 |
|
AMWH1 |
215-216 |
71-74 |
31-33 |
53-54 |
22-23 |
|
AMWH2 |
215-216 |
71-74 |
31-33 |
53-54 |
22-23 |
|
AMYH1 |
215-216 |
71-73 |
31-33 |
53-54 |
22-23 |
|
AMYH2 |
215-216 |
71-72 |
31-33 |
53 |
22-23 |
|
AMYL1 |
194 |
71 |
32-33 |
53 |
23 |
|
AOTT1 |
194 |
70 |
32 |
52 |
23 |
|
AOTT2 |
194 |
70 |
32 |
52 |
23 |
|
APCH1 |
194 |
71-72 |
32-34 |
53 |
23 |
|
APH1 |
215 |
71-72 |
32-34 |
53 |
23 |
|
APMH1 |
194 |
71-75 |
32-36 |
53-54 |
23-24 |
|
APMH2 |
194 |
71-75 |
32-36 |
53 |
23-24 |
|
APO1 |
215 |
71 |
31-32 |
53 |
22-23 |
|
APO2 |
194 |
69 |
31-32 |
52 |
22 |
|
APOH1 |
194-214 |
71-78 |
32-39 |
53-54 |
23-24 |
|
APOH2 |
194-209 |
71-78 |
32-39 |
53-54 |
23-24 |
|
APRC1 |
194 |
70 |
32 |
52 |
23 |
|
APT1 |
215 |
71 |
32 |
53 |
23 |
|
APTH1 |
194-261 |
71-82 |
32-42 |
53-55 |
23-25 |
|
ARBS1 |
186-187 |
69-72 |
32-33 |
52-54 |
23-24 |
|
ARP1 |
186-195 |
69-79 |
32-38 |
52-54 |
23-24 |
|
ARP2 |
186-206 |
69-81 |
32-39 |
52-55 |
23-24 |
|
ARP3 |
186-220 |
69-82 |
32-40 |
52-55 |
23-24 |
|
ARP4 |
186-224 |
69-82 |
32-40 |
52-55 |
23-25 |
|
ARP5 |
266-354 |
83-98 |
41-49 |
54-57 |
24-26 |
|
ASC1 |
194 |
69-70 |
31-32 |
52 |
22-23 |
|
ASC2 |
194 |
69-70 |
31-32 |
52 |
22-23 |
|
ASC3 |
194 |
69-70 |
31-32 |
52 |
22-23 |
|
ASCOE1 |
194 |
71 |
32-33 |
53-54 |
23 |
|
ASCW1 |
186-187 |
70-71 |
32-33 |
52-53 |
23 |
|
ASFH1 |
186-188 |
69-74 |
32-34 |
52-53 |
23 |
|
ASGSS1 |
187-188 |
70-72 |
33 |
52-53 |
23 |
|
APY1 |
186-187 |
70-71 |
32-33 |
52-53 |
23 |
|
ASHR1 |
186-187 |
71 |
33 |
53 |
23 |
|
ASIB1 |
194 |
69-72 |
31-33 |
52-54 |
22-23 |
|
ASK1 |
189 |
70-71 |
32 |
52-53 |
23 |
|
ASK2 |
189 |
70-71 |
32-33 |
52-53 |
23 |
|
ASLMS1 |
215-216 |
71-73 |
32-33 |
53-54 |
22-23 |
|
ASMIB1 |
186-187 |
69-72 |
32-33 |
52-53 |
23 |
|
ASRACP1 |
264-350 |
81-90 |
41-49 |
55-56 |
25-26 |
|
ASTC1 |
194-195 |
72-74 |
33-34 |
53-54 |
23 |
|
ASTC2 |
194-195 |
72-73 |
33-34 |
53-54 |
23 |
|
ASTC3 |
194-195 |
72-74 |
33 |
53 |
23 |
|
ASTMC1 |
187-188 |
71-73 |
33-34 |
52-53 |
23 |
|
ASTP1 |
194 |
70 |
33 |
52 |
23 |
|
ASTP2 |
194 |
70 |
32 |
52 |
23 |
|
ASTPS1 |
202-203 |
72 |
33 |
54 |
24 |
|
ASTT1 |
206-211 |
74 |
34 |
54 |
23 |
|
ASTTNV1 |
195 |
72 |
33 |
54 |
23 |
|
ASTTV1 |
258-273 |
75-79 |
35-37 |
54-55 |
24 |
|
ASTTV2 |
218-376 |
75-90 |
35-43 |
54-56 |
24-25 |
|
ASTTV3 |
195-286 |
76-87 |
35-41 |
54-56 |
24-25 |
|
ASTTV4 |
195-242 |
76-83 |
36-39 |
54-55 |
24 |
|
ASTTV5 |
191-228 |
76-84 |
36-41 |
53-55 |
24 |
|
ASTTV6 |
192-274 |
76-89 |
36-44 |
53-56 |
24-25 |
|
ASTTV7 |
191-356 |
74-99 |
36-50[1] |
53-57 |
23-26 |
|
ASTWV1 |
189 |
70-71 |
32-33 |
53 |
23 |
|
ASYH1 |
186-188 |
69-75 |
32-35 |
52-53 |
23 |
|
ASYH2 |
186-189 |
69-75 |
32-35 |
52-53 |
23 |
|
ATFSR1 |
194 |
70 |
32 |
52 |
23 |
|
ATFSR2 |
194 |
70 |
32 |
52 |
23 |
|
ATFSR3 |
194 |
70 |
32 |
52 |
23 |
|
ATL1 |
194 |
70 |
32 |
52 |
23 |
|
ATLWE1 |
194 |
69 |
32 |
52 |
22 |
|
ATLWE2 |
194 |
69 |
32 |
52 |
22 |
|
ATLWV1 |
194 |
70 |
32 |
52 |
23 |
|
ATLWV2 |
194 |
70 |
32 |
52 |
23 |
|
ATLWV3 |
194 |
70 |
32 |
52 |
23 |
|
ATLWV4 |
194 |
70 |
32 |
52 |
23 |
|
ATLWV5 |
194 |
70 |
32 |
52 |
23 |
|
ATLWV6 |
194 |
70 |
32 |
52 |
23 |
|
ATPHS1 |
195-196 |
73 |
33-34 |
54 |
23 |
|
ATPHS2 |
195-196 |
73-74 |
33-34 |
54 |
23 |
|
ATPHS3 |
196 |
74-75 |
34 |
54 |
23 |
|
ATSV1 |
198 |
71 |
32 |
53 |
23 |
|
ATTU1 |
194 |
73-78 |
35-38 |
53-54 |
23-24 |
|
ATTU2 |
194-341 |
74-84 |
35-45 |
53-55 |
23-25 |
|
ATTU3 |
194-216 |
74-80 |
35-40 |
53-55 |
24 |
|
ATTU4 |
202-272 |
74-84 |
36-43 |
53-55 |
24-25 |
|
ATTUN1 |
194-264 |
74-84 |
36-42 |
53-55 |
24-25 |
|
ATTUP1 |
194 |
76 |
37 |
53 |
24 |
|
ATUV1 |
194-196 |
71-72 |
33 |
53 |
23 |
|
ATUV2 |
194 |
72 |
33-34 |
53 |
23 |
|
ATUV3 |
194 |
71-72 |
33 |
53 |
23 |
|
ATWNV1 |
203 |
71-72 |
33 |
54 |
23 |
|
ATWNV2 |
203 |
72 |
33 |
54 |
24 |
|
AVLP1 |
194 |
70 |
32 |
52 |
23 |
|
AVLP2 |
194 |
70 |
32 |
53 |
23 |
|
AVM1 |
194 |
70 |
32 |
52 |
23 |
|
AWSH1 |
194-195 |
71-73 |
32-33 |
53-54 |
23 |
|
AWSH2 |
186-188 |
69-71 |
32-33 |
52-53 |
23 |
|
AWWC1 |
194 |
69-70 |
31-32 |
52-53 |
22-23 |
|
AWWTC1 |
215 |
71-72 |
32 |
53 |
23 |
|
AWWTC2 |
215 |
71-72 |
32 |
53 |
23 |
|
A39 |
194 |
69 |
31-32 |
52 |
22 |
[1] Predicted annual RSP concentration at ASTTV7 at 1.5mAG is 49.6 μg/m3 and below AQO of 50 μg/m3
3.7.1.2 According to the predicted results in Table 3.10, the predictions indicated that the 1st highest hourly average TSP, 10th highest daily average and annual average of RSP and FSP concentrations at all representative ASRs would comply with the EIAO-TM and the respective AQOs. No adverse air quality impact due to the construction of the Project is anticipated.
3.7.1.3 According to the predicted results, the worst hit level at the representative ASRs generally appears at the first air sensitive use level (i.e. 1.5mAG). 1.5mAG was considered the best representing the lowest level of most of the air sensitive uses within the Study Area. Contour plots of the 1st highest hourly average TSP, 10th highest daily average and annual average of RSP and FSP concentrations at 1.5mAG during construction phase are thus predicted and presented in Figure 3.4.1, Figure 3.4.2, Figure 3.5.1, Figure 3.5.2, Figure 3.6.1, Figure 3.6.2, Figure 3.7.1, Figure 3.7.2, Figure 3.8.1 & Figure 3.8.2.
3.7.1.4 Referring to the contour plots, no exceedance zone is found for 1st highest hourly average TSP, 10th daily average of RSP and FSP, and annual average of FSP concentrations. Exceedance zones are found for the annual average RSP concentration at 1.5mAG. The exceedance zones are located on Sha Tin Road near Pok Hong Estate and near the intersection between Che Kung Miu Road and Lion Rock Tunnel Road. No air sensitive uses are identified within these areas.
Cumulative impacts from concurrent project
3.7.1.5 The work site of “Revitalisation of Tai Wai Nullah” (hereafter called “the Nullah Project”) will be within 500 m assessment area of this Project. Its construction programme would also be overlapped with that of the Project. The most dusty construction works of the Project within the site area of overlapping with the Revitalisation of Tai Wai Nullah project would be the foundation works for the T4 viaducts and potential construction dust impact from the Nullah Project is anticipated to be limited with the proper implementation of good site practices. Nevertheless, DSD’s and CEDD’s contractors should closely liaise to avoid construction works carrying out concurrently within the same interface areas and CEDD has agreed to include this requirement in the respective works contract to ensure that the nearby ASRs would not be subject to adverse cumulative construction dust impact. The EIA study for the Nullah Project will be conducted and appropriate mitigation measures would also be proposed for implementation such that it would not have unacceptable construction impact. Hence, adverse cumulative construction impact from both projects would not be anticipated.
3.7.2 Operation Phase
3.7.2.1 The cumulative air quality impacts due to background pollutant concentrations, vehicular emissions from open roads, portals (existing full enclosures, proposed T4 underpasses and proposed full enclosures), bus and minibus termini, heavy goods vehicle and coach parking sites, and industrial emissions in the vicinity of the Project at the representative ASRs have been evaluated. The predicted cumulative air quality impacts at the ASRs under With Project (With DNR) Scenario are summarized in Table 3.11. The detailed assessment results are presented in Appendix 3.14.
Table 3.11 Predicted Cumulative Concentrations at Representative Air Sensitive Receivers under With Project (With DNR) Scenario
|
ASR |
NO2 Concentration (µg/m3) |
RSP Concentration (µg/m3) |
FSP Concentration (µg/m3) |
|||
|
19th Highest Hourly Average |
Annual Average |
10th Highest Daily Average |
Annual Average |
10th Highest Daily Average |
Annual Average |
|
|
AQO |
200 |
40 |
100 |
50 |
75 |
35 |
|
AAG1 |
107 - 128 |
20 - 27 |
70 - 71 |
32 |
52 - 53 |
23 |
|
ACC1 |
100 - 107 |
17 - 20 |
71 |
32 |
53 |
23 |
|
ACCS1 |
129 - 135 |
28 - 33 |
70 |
32 - 33 |
53 |
23 |
|
ACCS2 |
127 - 135 |
28 - 33 |
70 |
32 - 33 |
53 |
23 |
|
ACTC1 |
101 - 138 |
16 - 31 |
69 - 70 |
31 - 32 |
52 |
22 - 23 |
|
ADCMS1 |
101 - 120 |
15 - 23 |
71 |
32 - 33 |
53 |
23 |
|
AEBI1 |
123 - 128 |
23 - 25 |
69 - 70 |
32 |
52 |
23 |
|
AEBI2 |
120 - 124 |
23 - 24 |
69 |
32 |
52 |
23 |
|
AEBI3 |
123 - 127 |
23 - 25 |
69 - 70 |
32 |
52 |
23 |
|
AFSH1 |
96 - 109 |
13 - 18 |
71 |
32 |
53 |
23 |
|
AFYHN1 |
115 - 130 |
21 - 30 |
71 |
33 |
54 |
23 - 24 |
|
AFYHN2 |
114 - 116 |
19 - 21 |
71 |
32 - 33 |
53 |
23 |
|
AFYHN3 |
114 - 115 |
20 - 21 |
71 |
32 - 33 |
54 |
23 |
|
AGG1 |
113 - 131 |
22 - 32 |
71 |
32 - 33 |
53 - 54 |
23 |
|
AGH1 |
105 - 124 |
17 - 22 |
69 |
31 - 32 |
52 |
22 |
|
AGH2 |
122 - 124 |
22 |
69 |
32 |
52 |
22 - 23 |
|
AGW1 |
112 - 128 |
21 - 32 |
71 |
32 - 33 |
53 - 54 |
23 |
|
AHCH1 |
100 - 103 |
14 - 19 |
71 |
31 - 32 |
53 |
22 - 23 |
|
AHG1 |
112 - 132 |
21 - 33 |
71 - 72 |
32 - 33 |
53 - 54 |
23 - 24 |
|
AHKHM1 |
115 - 122 |
24 - 27 |
70 |
32 |
52 - 53 |
23 |
|
AHKHM2 |
111 - 115 |
22 - 25 |
69 - 70 |
31 - 32 |
52 |
22 - 23 |
|
AHL1 |
124 - 131 |
23 - 25 |
69 |
32 |
52 |
23 |
|
AHL2 |
122 - 125 |
22 - 24 |
69 |
32 |
52 |
22 - 23 |
|
AHP1 |
101 - 129 |
15 - 29 |
69 - 70 |
31 - 32 |
52 |
22 - 23 |
|
AHP2 |
101 - 127 |
15 - 27 |
69 - 70 |
31 - 32 |
52 |
22 - 23 |
|
AHP3 |
100 - 134 |
15 - 29 |
69 - 70 |
31 - 32 |
52 |
22 - 23 |
|
AHRCC1 |
117 - 118 |
24 - 26 |
69 - 70 |
32 |
52 |
23 |
|
AIC1 |
102 - 129 |
15 - 27 |
69 |
31 - 32 |
52 |
22 - 23 |
|
AIC2 |
101 - 138 |
15 - 28 |
69 |
31 - 32 |
52 |
22 - 23 |
|
AISSTW1 |
100 - 105 |
17 - 19 |
71 |
32 |
53 |
23 |
|
AJGC1 |
117 - 134 |
22 - 31 |
69 - 70 |
32 - 33 |
52 - 53 |
23 |
|
AKTS1 |
109 - 118 |
21 - 24 |
69 |
32 |
52 |
23 |
|
AKWB1 |
130 - 145 |
29 - 37 |
71 - 72 |
33 |
54 |
23 - 24 |
|
ALCY1 |
123 - 125 |
26 - 27 |
70 |
32 |
53 |
23 |
|
ALDSC1 |
132 - 137 |
28 - 29 |
70 |
32 |
52 |
23 |
|
ALJS1 |
118 - 122 |
24 - 26 |
70 |
32 |
52 |
23 |
|
ALUT1 |
114 - 118 |
23 - 27 |
69 - 70 |
32 |
52 - 53 |
23 |
|
ALUT2 |
116 - 119 |
24 - 27 |
69 - 70 |
32 |
52 |
23 |
|
ALUT3 |
115 - 121 |
23 - 29 |
69 - 70 |
32 |
52 - 53 |
23 |
|
AMFSS1 |
113 - 124 |
21 - 26 |
69 - 70 |
32 |
52 - 53 |
23 |
|
AMFSS2 |
108 - 123 |
20 - 26 |
69 - 70 |
31 - 32 |
52 - 53 |
22 - 23 |
|
AMLC1 |
107 - 118 |
18 - 24 |
69 - 70 |
32 |
52 |
23 |
|
AMLPS1 |
102 - 115 |
16 - 21 |
71 |
31 - 32 |
53 |
22 - 23 |
|
AMPC1 |
100 - 108 |
14 - 19 |
71 |
31 - 32 |
53 |
22 - 23 |
|
AMSC1 |
100 - 106 |
14 - 21 |
71 |
31 - 32 |
53 |
22 - 23 |
|
AMSC2 |
100 - 105 |
14 - 20 |
71 |
31 - 32 |
53 |
22 - 23 |
|
AMSL1 |
96 - 121 |
13 - 21 |
71 |
32 - 33 |
53 |
23 |
|
AMTH1 |
100 - 118 |
14 - 22 |
71 |
31 - 32 |
53 |
22 - 23 |
|
AMTH2 |
100 - 124 |
14 - 23 |
71 |
31 - 32 |
53 |
22 - 23 |
|
AMWH1 |
100 - 107 |
14 - 22 |
71 |
31 - 32 |
53 |
22 - 23 |
|
AMWH2 |
100 - 107 |
14 - 22 |
71 |
31 - 32 |
53 |
22 - 23 |
|
AMYH1 |
100 - 110 |
14 - 20 |
71 |
31 - 32 |
53 |
22 - 23 |
|
AMYH2 |
100 - 111 |
15 - 21 |
71 |
31 - 32 |
53 |
22 - 23 |
|
AMYL1 |
96 - 117 |
13 - 21 |
71 |
32 - 33 |
53 |
23 |
|
AOTT1 |
121 - 132 |
22 - 26 |
69 - 70 |
32 |
52 |
23 |
|
AOTT2 |
121 - 137 |
23 - 27 |
69 - 70 |
32 |
52 |
23 |
|
APCH1 |
96 - 116 |
13 - 22 |
71 |
32 - 33 |
53 |
23 |
|
APH1 |
114 - 116 |
18 - 19 |
71 |
32 |
53 |
23 |
|
APMH1 |
96 - 111 |
13 - 18 |
71 |
32 |
53 |
23 |
|
APMH2 |
96 - 110 |
13 - 18 |
71 |
32 |
53 |
23 |
|
APO1 |
100 - 110 |
14 - 17 |
71 |
31 - 32 |
53 |
22 |
|
APO2 |
102 - 115 |
16 - 19 |
69 |
31 |
52 |
22 |
|
APOH1 |
96 - 109 |
13 - 18 |
71 |
32 |
53 |
23 |
|
APOH2 |
96 - 106 |
13 - 18 |
71 |
32 |
53 |
23 |
|
APRC1 |
130 |
26 - 27 |
70 |
32 |
52 |
23 |
|
APT1 |
104 - 105 |
17 - 18 |
71 |
32 |
53 |
23 |
|
APTH1 |
96 - 107 |
13 - 18 |
71 |
32 |
53 |
23 |
|
APY1 |
116 - 123 |
22 - 28 |
69 - 70 |
32 |
52 - 53 |
23 |
|
ARBS1 |
107 - 138 |
19 - 33 |
69 - 71 |
32 - 33 |
52 - 53 |
23 |
|
ARP1 |
106 - 123 |
17 - 27 |
69 - 70 |
32 |
52 |
23 |
|
ARP2 |
106 - 124 |
17 - 28 |
69 - 70 |
32 |
52 |
23 |
|
ARP3 |
106 - 127 |
17 - 29 |
69 - 70 |
32 |
52 - 53 |
23 |
|
ARP4 |
106 - 128 |
17 - 30 |
69 - 70 |
32 - 33 |
52 - 53 |
23 |
|
ARP5 |
127 - 131 |
30 - 31 |
70 |
32 - 33 |
53 |
23 |
|
ASC1 |
101 - 129 |
15 - 27 |
69 - 70 |
31 - 32 |
52 |
22 - 23 |
|
ASC2 |
101 - 131 |
15 - 27 |
69 - 70 |
31 - 32 |
52 |
22 - 23 |
|
ASC3 |
100 - 135 |
15 - 28 |
69 - 70 |
31 - 32 |
52 |
22 - 23 |
|
ASCOE1 |
96 - 114 |
13 - 20 |
71 - 72 |
32 |
53 - 54 |
23 |
|
ASCW1 |
114 - 123 |
22 - 26 |
69 - 70 |
32 |
52 |
23 |
|
ASFH1 |
106 - 120 |
18 - 28 |
69 - 70 |
32 |
52 - 53 |
23 |
|
ASGSS1 |
115 - 120 |
22 - 25 |
69 - 70 |
32 |
52 |
23 |
|
ASHR1 |
123 - 127 |
27 - 30 |
70 |
32 - 33 |
53 |
23 |
|
ASIB1 |
102 - 145 |
17 - 35 |
69 - 71 |
31 - 32 |
52 - 54 |
22 - 23 |
|
ASK1 |
103 - 114 |
20 - 24 |
70 |
32 |
52 - 53 |
23 |
|
ASK2 |
105 - 125 |
20 - 30 |
70 - 71 |
32 |
52 - 53 |
23 |
|
ASLMS1 |
100 - 106 |
15 - 21 |
71 |
31 - 32 |
53 |
22 - 23 |
|
ASMIB1 |
107 - 136 |
19 - 32 |
69 - 70 |
32 - 33 |
52 - 53 |
23 |
|
ASRACP1 |
117 - 119 |
20 |
71 |
32 |
53 |
23 |
|
ASTC1 |
131 - 135 |
30 - 31 |
70 - 71 |
32 |
53 |
23 |
|
ASTC2 |
123 - 126 |
27 - 29 |
70 |
32 |
53 |
23 |
|
ASTC3 |
118 - 120 |
25 - 26 |
70 |
32 |
53 |
23 |
|
ASTMC1 |
110 - 114 |
21 - 23 |
69 |
32 |
52 |
23 |
|
ASTP1 |
122 |
27 |
70 |
32 |
52 |
23 |
|
ASTP2 |
120 |
23 |
69 |
32 |
52 |
23 |
|
ASTPS1 |
130 - 135 |
32 - 34 |
71 - 72 |
33 |
54 |
24 |
|
ASTT1 |
114 - 115 |
20 |
71 |
33 |
54 |
23 |
|
ASTTNV1 |
100 - 108 |
16 - 17 |
71 |
32 |
53 |
23 |
|
ASTTV1 |
108 - 111 |
18 - 21 |
71 |
32 - 33 |
53 |
23 |
|
ASTTV2 |
108 - 112 |
18 - 21 |
71 |
32 - 33 |
53 - 54 |
23 |
|
ASTTV3 |
109 - 112 |
18 - 20 |
71 |
32 |
53 |
23 |
|
ASTTV4 |
109 - 111 |
18 - 20 |
71 |
32 |
53 |
23 |
|
ASTTV5 |
117 - 120 |
24 - 27 |
69 - 70 |
32 |
52 |
23 |
|
ASTTV6 |
117 - 124 |
25 - 30 |
70 |
32 |
52 - 53 |
23 |
|
ASTTV7 |
117 - 124 |
24 - 30 |
69 - 70 |
32 |
52 - 53 |
23 |
|
ASTWV1 |
110 - 114 |
25 - 28 |
70 - 71 |
32 |
53 |
23 |
|
ASYH1 |
107 - 120 |
18 - 27 |
69 - 70 |
32 |
52 - 53 |
23 |
|
ASYH2 |
106 - 118 |
18 - 25 |
69 |
32 |
52 |
23 |
|
ATFSR1 |
124 - 125 |
24 - 25 |
70 |
32 |
52 |
23 |
|
ATFSR2 |
124 - 126 |
25 - 26 |
70 |
32 |
52 |
23 |
|
ATFSR3 |
123 - 124 |
24 - 25 |
70 |
32 |
52 |
23 |
|
ATL1 |
121 - 122 |
23 - 24 |
70 |
32 |
52 |
23 |
|
ATLWE1 |
116 - 118 |
19 - 20 |
69 |
31 |
52 |
22 |
|
ATLWE2 |
117 - 119 |
20 |
69 |
31 |
52 |
22 |
|
ATLWV1 |
131 - 133 |
25 - 26 |
69 |
32 |
52 |
23 |
|
ATLWV2 |
136 - 139 |
26 - 28 |
69 - 70 |
32 |
52 |
23 |
|
ATLWV3 |
136 - 140 |
27 |
69 |
32 |
52 |
23 |
|
ATLWV4 |
137 - 140 |
26 - 27 |
69 |
32 |
52 |
23 |
|
ATLWV5 |
131 - 139 |
25 - 26 |
69 |
32 |
52 |
23 |
|
ATLWV6 |
128 - 131 |
23 - 25 |
69 |
32 |
52 |
23 |
|
ATPHS1 |
112 - 113 |
18 - 19 |
71 |
32 |
54 |
23 |
|
ATPHS2 |
110 |
18 |
71 |
32 |
54 |
23 |
|
ATPHS3 |
107 |
17 |
71 |
32 |
53 |
23 |
|
ATSV1 |
92 - 93 |
13 |
71 |
32 |
53 - 54 |
23 |
|
ATTU1 |
111 - 112 |
18 - 20 |
71 |
32 |
53 |
23 |
|
ATTU2 |
111 - 114 |
19 - 20 |
71 |
32 - 33 |
53 |
23 |
|
ATTU3 |
111 - 113 |
19 - 20 |
71 |
32 - 33 |
53 |
23 |
|
ATTU4 |
113 - 114 |
21 |
71 |
33 |
53 |
23 |
|
ATTUN1 |
114 - 115 |
20 |
71 |
32 - 33 |
53 |
23 |
|
ATTUP1 |
115 |
20 |
71 |
32 |
53 |
23 |
|
ATUV1 |
116 - 140 |
24 - 30 |
71 |
33 |
53 |
23 - 24 |
|
ATUV2 |
115 - 125 |
23 - 25 |
71 |
33 |
53 |
23 |
|
ATUV3 |
116 - 117 |
20 - 21 |
71 |
32 - 33 |
53 |
23 |
|
ATWNV1 |
131 - 132 |
28 - 30 |
71 |
33 |
54 |
23 |
|
ATWNV2 |
132 - 136 |
33 |
72 |
33 |
54 |
24 |
|
AVLP1 |
122 - 124 |
25 - 26 |
70 |
32 |
52 |
23 |
|
AVLP2 |
123 - 125 |
26 - 27 |
70 |
32 |
52 - 53 |
23 |
|
AVM1 |
131 - 134 |
26 - 27 |
70 |
32 |
52 |
23 |
|
AWSH1 |
96 - 109 |
13 - 19 |
71 |
32 |
53 |
23 |
|
AWSH2 |
106 - 119 |
17 - 24 |
69 |
32 |
52 |
23 |
|
AWWC1 |
100 - 133 |
15 - 31 |
69 - 70 |
31 - 32 |
52 - 53 |
22 - 23 |
|
AWWTC1 |
110 - 118 |
19 - 22 |
71 |
32 |
53 |
23 |
|
AWWTC2 |
114 - 126 |
20 - 24 |
71 |
32 |
53 |
23 |
|
A39 |
100 - 120 |
15 - 21 |
69 |
31 |
52 |
22 |
3.7.2.2 According to the predicted results in Table 3.11, the predictions indicated that the 19th highest hourly average NO2, annual average NO2, 10th highest daily average and annual average of RSP and FSP concentrations at all representative ASRs would comply with the respective AQOs.
3.7.2.3 According to the predicted results, the worst hit level at the representative ASRs generally appears at the first air sensitive use level. 1.5mAG was considered the best representing the lowest level of most of the air sensitive uses within the Study Area. Contour plots of the 19th highest hourly average and annual average NO2 concentrations, 10th highest daily average and annual average RSP concentrations, and 10th highest daily average and annual average FSP concentrations at 1.5mAG under With Project (With DNR) Scenario are thus predicted and presented in Figure 3.9.1, Figure 3.9.2, Figure 3.10.1, Figure 3.10.2, Figure 3.11.1, Figure 3.11.2, Figure 3.12.1, Figure 3.12.2, Figure 3.13.1, Figure 3.13.2, Figure 3.14.1 & Figure 3.14.2.
3.7.2.4 Referring to the contour plots in Figure 3.9.1, Figure 3.9.2, Figure 3.10.1, Figure 3.10.2, Figure 3.11.1, Figure 3.11.2, Figure 3.12.1, Figure 3.12.2, Figure 3.13.1, Figure 3.13.2, Figure 3.14.1 & Figure 3.14.2, no exceedance zone is found for the 19th highest hourly average NO2 concentration, as well as 10th daily average and annual average of RSP and FSP concentrations. Exceedance zones are found for annual average NO2 concentration at 1.5mAG, with the first one is located on Tai Po Road near the intersection with Mei Tin Road, and the other is located at Shatin Central Bus Terminus. However, no air-sensitive uses including openable window/fresh air intake of the ventilation system are identified within these exceedance areas.
Incremental Air Quality Impact
3.7.2.5 By comparing the assessment results under “with” and “without” project scenarios, Project contribution in future year (i.e. Year 2028) could then be quantified. The predicted incremental air quality impact is summarized in Table 3.12. Detailed results are presented in Appendix 3.15. With the results predicted in Table 3.11, adverse air quality impact during the operation of the Project is not expected.
Table 3.12 Summary of Incremental Air Quality Impact
Pollutant |
Predicted max. concentration changes, μg/m3 |
Predicted cumulative conc. at the event with max. concentration changes, μg/m3 |
|
NO2 |
19th Highest Hourly Average |
24.7 |
140 |
Annual Average |
9.4 |
30 |
|
RSP |
10th Highest Daily Average |
0.4 |
70 |
Annual Average |
0.4 |
33 |
|
FSP |
10th Highest Daily Average |
0.4 |
53 |
Annual Average |
0.4 |
24 |
|
Air Quality Implication due to the Recommended Direct Technical Noise Remedies (DNR)
3.7.2.6 In order to investigate the air quality implications induced by the proposed DNR, the predicted cumulative air quality impacts at the ASRs under With Project (Without DNR) Scenario have been evaluated and the detailed assessment results are presented in Appendix 3.16. According to Appendix 3.16, the changes are in the ranges of -10 – 20 (19th highest hourly average NO2), -5 – 8 (annual average NO2), -0.18 – 0.06 (10th highest daily average RSP), -0.31 – 0.34 (annual average RSP), -0.17 – 0.05 (10th highest daily average FSP) and -0.28 – 0.31 (annual average FSP). The air quality impact induced by the proposed DNR are negligible at most of the ASRs. For particular ASRs located near the portal emission sources arising from the proposed DNR or on the side of opening of the proposed semi-enclosures, the increase in pollutant concentrations would not result in any unacceptable adverse air quality impacts.
3.8 Mitigation of Adverse Environmental Impacts
3.8.1 Construction Phase
3.8.1.1 In addition to the dust control measure described in Section 3.6.1.5, dust suppression measures stipulated in the Air Pollution Control (Construction Dust) Regulation and good site practices listed below should be carried out to further minimize construction dust impact.
· Use of regular watering to reduce dust emissions from exposed site surfaces and unpaved roads, particularly during dry weather.
· Use of frequent watering for particularly dusty construction areas and areas close to ASRs.
· Side enclosure and covering of any aggregate or dusty material storage piles to reduce emissions. Where this is not practicable owing to frequent usage, watering shall be applied to aggregate fines.
· Open stockpiles shall be avoided or covered. Where possible, prevent placing dusty material storage piles near ASRs.
· Tarpaulin covering of all dusty vehicle loads transported to, from and between site locations.
· Establishment and use of vehicle wheel and body washing facilities at the exit points of the site.
· Provision of wind shield and dust extraction units or similar dust mitigation measures at the loading area and use of water sprinklers at the loading area where dust generation is likely during the loading process of loose material, particularly in dry seasons/ periods.
· Provision of not less than 2.4m high hoarding from ground level along site boundary where adjoins a road, streets or other accessible to the public except for a site entrance or exit.
· Imposition of speed controls for vehicles on site haul roads.
· Where possible, routing of vehicles and positioning of construction plant should be at the maximum possible distance from ASRs.
· Instigation of an environmental monitoring and auditing program to monitor the construction process in order to enforce controls and modify method of work if dusty conditions arise.
· Temporarily stockpile odorous material as far away from ASRs as possible.
· Temporary stockpiles of odorous material will be properly covered with tarpaulin to avoid any odour nuisance arising.