Agreement No. CE 109/98
Deep Bay Link
Investigation and Preliminary Design
Environmental Impact Assessment Report
VOLUME 2 OF 3 (FIGURES)
Figure 1.1(A, B, C, D)		Deep Bay Link General Layout Plan
Figure 1.2 			Deep Bay Link PPFS Alignment Alternatives
Figure 1.3			Deep Bay Link Tunnel Options
Figure 1.4			Deep Bay Link Options Considered in this Project
Figure 1.5			Constraints Identified and Considered in Choosing Deep Bay Link Alignment
Figure 1.7			Depressed Alignment of Deep Bay Link
Figure 1.8			Recommended Outline Development Plan (RODP) of Hung Shui Kiu New Development Area (HSKNDA) (Formerly Known as HSK Strategic Growth Area (SGA))
Figure 2.1(A, B, C, D, E, F)		Locations of Air Sensitive Receivers
Figure 2.2(A, B, C, D, E, F)		Concentration Contours of Predicted Worst-case 1-hour Average Nitrogen Dioxide Level at 1.5m Above Ground
Figure 2.3(A, B, C, D, E, F)		Concentration Contours of Predicted Worst-case 1-hour Average Nitrogen Dioxide Level at 10m Above Ground
Figure 2.4(A, B, C, D, E, F)		Concentration Contours of Predicted Worst-case 24-hour Average Nitrogen Dioxide Level at 1.5m Above Ground
Figure 2.5(A, B, C, D, E, F)		Concentration Contours of Predicted Worst-case 24-hour Average Nitrogen Dioxide Level at 10m Above Ground
Figure 2.6(A, B, C, D, E, F)		Concentration Contours of Predicted Worst-case 24-hour Average Respirable Suspended Particulates Level at 1.5m Above Ground
Figure 2.7(A, B, C, D, E, F)		Concentration Contours of Predicted Worst-case 24-hour Average Respirable Suspended Particulates Level at 10m Above Ground
Figure 2.8			Concentration Contours of Predicted Worst-case 1-hour Average Nitrogen Dioxide Level at 1.5m Above Ground (for Alternative HSK-NDA Layout)
Figure 2.9			Concentration Contours of Predicted Worst-case 1-hour Average Nitrogen Dioxide Level at 10m Above Ground (for Alternative HSK-NDA Layout)
Figure 2.10			Concentration Contours of Predicted Worst-case 24-hour Average Nitrogen Dioxide Level at 1.5m Above Ground (for Alternative HSK-NDA Layout)
Figure 2.11			Concentration Contours of Predicted Worst-case 24-hour Average Nitrogen Dioxide Level at 10m Above Ground (for Alternative HSK-NDA Layout)
Figure 2.12			Concentration Contours of Predicted Worst-case 24-hour Average Respirable Suspended Particulates Level at 1.5m Above Ground (for Alternative HSK-NDA Layout)
Figure 2.13			Concentration Contours of Predicted Worst-case 24-hour Average Respirable Suspended Particulates Level at 10m Above Ground (for Alternative HSK-NDA Layout)
Figure 2.14			Existing and Planned Major Air Pollution Sources Further Away from the Study Area
Figure 3.1(A, B, C, D, E, F)		Locations of Noise Sensitive Receivers
Figure 3.2(A, B, C, D, E, F,		Proposed Traffic Noise Mitigation Measures
G, H, I, J, K)
Figure 3.3			Location of the Proposed Helipad
Figure 3.19			Proposed Speed Limits
Figure 3.20(A, B)			Proposed Purpose-built Site Hoarding Location
Figure 3.21 			Construction Noise Purpose-Built Site Hoarding Setup
Figure 3.22			Illustration of the Proposed Construction Method
Figure 3.24A			Locations of Notional Noise Source for Construction Noise Assessment at Ngau Hom Shek
Figure 3.24(B, C, D, E, F)		Locations of Notional Noise Source for Construction Noise Assessment
Figure 3.25			Proposed Routes for Construction Site Access
Figure 3.31			Locations of Noise Sensitive Receivers for Alternative HSK-NDA Layout
Figure 3.32			HSK-NDA Layout with Typical School Layout Included for 2B & 2C
Figure 3.33			Alternative HSK-NDA Layout with Typical School Layout Included for 2B & 2C
Figure 3.34			Road Classification for Assessment
Figure 4.1			Locations of the Main Streams, Tuen Mun River Channel and Tin Shui Wai Nullah
Figure 4.2 			Local Stream Courses
Figure 4.3			Precautionary Drainage Measures During Bored Pile Construction - Plan
Figure 4.4			An Example of the Performance of a Wastewater Treatment System
Figure 4.5 			Precautionary Drainage Measures During Bored Pile Construction - Section
Figure 4.6 			Proposed Effluent Discharged Points/Monitoring Stations
Figure 4.7 			The Main Region for Removal of Road Sludge
Figure 6.1(A, B, C) Key Sites Identified for Land Contamination Assessment
Figure 7.1(A, B, C, D) Habitats Identified Along the Proposed Deep Bay Link Alignment
Figure 7.2 Mammal, Mudflat and Stream Sample Sites and Fishpond Area
Figure 7.3 Sampling Site for Epi-in-fauna Survey and Mangrove Survey along Shoreline at Ngau Hom Shek
Figure 7.4 Survey at Ngau Hom Shek Shek - Stream Sampling Location (S1) and Mammal Trapping Site (M1)
Figure 7.5 Fishpond Survey - Stream Sampling Location (S3) and Mammal Trapping Sites (M2, M3)
Figure 7.6 Survey at Hung Shui Kiu Stream - Sampling Sites (S4, S5) and Mammal Trapping Site (M4)
Figure 7.7 Deep Bay Link Ornithological Survey Transects 1-7, and Stream Samples Location, Shoreline Study Area and Egretry Location
Figure 7.9 Conceptual Layout for the Proposed Ecological Compensation at Ngau Hom Shek
Figure 7.10 Culverts Proposed for Dry Shoulder Installation to Maintain Ecological Connectivity
Figure 7.11(A, B, C, D) Habitat Loss under DBL Project(Figures for Chapter 9 are in Volume I)Figure 9.1 Distribution of Graves at the Chung Shan Cemetery (Permitted Burial Ground No. 22)
Figure 9.2 A Section of the Tao Clan Cemetery at Chung Shan
Figure 9.3 The Gate of Nai Wai Village and the Inscribed Board with Characters of "Five Willow Trees in a Warm Breeze"
Figure 9.4 Location of Tsing Chuen Wai and Nai Wai
Figure 9.5 Front View of the Old Wall at Tsing Chuen Wai
Figure 9.6 Southeastern Corner of the Old Wall at Tsing Chuen Wai
Figure 9.7 Location of the Chan Clan Cemetery
Figure 9.8 The Chan Clan Cemtery at Tai Tau Shan
Figure 9.9 Grave of Chan Lien Fong and His Wife at Tai Tau Shan
Figure 9.10 Location of the Fung Shui Woodland at the Chan Clan Cemtery in Relation tot he New Scheme of DBL
Figure 9.11 The Entrance of the Chan Clan Fung Shui Woodland at Tai Tau Shan
Figure 9.12 Selection of the Chan Clan Fung Shui Woodland
Figure 9.13 The Grave of Chan Kwai Wah in the Chan Clan Fung Shui Woodland
Figure 9.14 Location of the Tang Cemetery at Location I
Figure 9.15 Collective Grave of Tang Clan Ancestors in Location I
Figure 9.16 The Grave of the 19th Generation Ancestor of the Tang Clan in Location I
Figure 9.17 Location of the Tang Clan Cemeteries at Location II & III
Figure 9.18 Collective Grave of the Tang Clan in Location II
Figure 9.19 The Newly Built Platform in Location III which has Crushed Tang Clan Graves
Figure 9.20 Location of the Proposed Deep Bay Link and Area Divisions
Figure 9.21 Geologic Map of the Proposed Deep Bay Link Area
Figure 9.22 Archaeological Survey in the Ngau Hom Shek Area
Figure 9.23 Stratigraphic Profiles of Test Pit T1, FC1 and FC2
Figure 9.24 Archaeological Survey in the Water Treatment Plant Area
Figure 9.25 Archaeological Survey in the Tsing Chuen Wai Area
Figure 9.26 Stratigraphic Profiles of Test Pit T2 and T3
Figure 9.27 Archaeological Excavation at Tsing Chuen Wai
Figure 9.28 Archaeological Survey in the Lam Tei Area
Figure 9.29 Stratigraphic Profiles of Test Pit T7 and T8
Figure 9.30 Location of Permitted Burial Ground No. 22
Figure 9.31 Plan of Mitigation Measures at Ngau Hom Shek
Figure 9.32 Plan of Rescue Excavation at Tsing Chuen Wai and Lam TeiFigure 10.4.1 Ha Tsuen - Outline Zoning Plan (OZP)
Figure 10.4.2 Ping Shan - Outline Zoning Plan (OZP)
Figure 10.4.3 Tong Yan San Tsuen - Outline Zoning Plan (OZP)
Figure 10.4.4a Lam Tei and Yick Tuen - Outline Zoning Plan (OZP)
Figure 10.5.1 Baseline Landscape Resources Key Plan
Figure 10.5.2 Baseline Landscape Conditions - Location of Landscape Resources & Landscape Character Zones
Figure 10.5.3 Baseline Landscape Conditions - Location of Landscape Resources & Landscape Character Zones
Figure 10.5.4 Baseline Landscape Conditions - Location of Landscape Resources & Landscape Character Zones
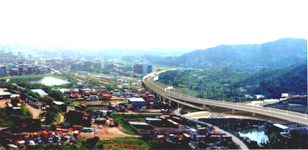
Figure 10.5.5 Baseline Landscape Characteristics Photo View No.1
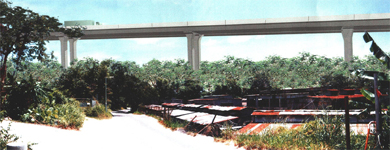
Figure 10.5.6 Baseline Landscape Characteristics Photo View No.2
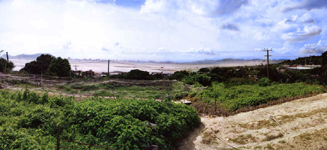
Figure 10.5.7 Baseline Landscape Characteristics Photo View No.3
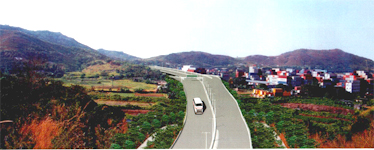
Figure 10.5.8 Baseline Landscape Characteristics Photo View No.4
Figure 10.5.9 Baseline Landscape Characteristics Photo View No.5
Figure 10.5.10 Baseline Landscape Characteristics Photo View No.6
Figure 10.5.11 Baseline Landscape Characteristics Photo View No.7
Figure 10.5.12 ZVI, Visibility Contours and VSRs for Construction and Operation Phase
Figure 10.6.1 Construction Phase Mitigation Measure (1 of 3)
Figure 10.6.2 Construction Phase Mitigation Measure (2 of 3)
Figure 10.6.3 Construction Phase Mitigation Measure (3 of 3)
Figure 10.6.3.1 Road Design Drawing - Typical Viaduct Sections
Figure 10.6.3.2 Road Design Drawing - Type A Column Details
Figure 10.6.3.3 Road Design Drawing - Type B Column Details
Figure 10.6.3.4 Road Design Drawing - Type C Column Details
Figure 10.6.3.5 Road Design Drawing - Extent of Noise Barriers
Figure 10.6.3.6 Road Design Drawing - Noise Barriers
Figure 10.6.3.7 Road Design Drawing - Typical Deck Section for Dual - 3 Carriageway
Figure 10.6.4 Construction Phase Residual Landscape & Visual Impact (1 of 3)
Figure 10.6.5 Construction Phase Residual Landscape & Visual Impact (2 of 3)
Figure 10.6.6 Construction Phase Residual Landscape & Visual Impact (3 of 3)
Figure 10.7.1 Operation Phase Mitigation Measure (1 of 6)
Figure 10.7.2 Operation Phase Mitigation Measure (2 of 6)
Figure 10.7.3 Operation Phase Mitigation Measure (3 of 6)
Figure 10.7.4 Operation Phase Mitigation Measure (4 of 6) - Lam Tei Interchange
Figure 10.7.5 Operation Phase Mitigation Measure (5 of 6) - Hung Shui Hiu Interchange
Figure 10.7.6 Operation Phase Mitigation Measure (6 of 6 - San Wai Sewerage Treatment Plant
Figure 10.7.7 Operation Phase Residual Landscape & Visual Impact (1 of 3)
Figure 10.7.8 Operation Phase Residual Landscape & Visual Impact (2 of 3)
Figure 10.7.9 Operation Phase Residual Landscape & Visual Impact (3 of 3)
Figure 10.7.14 Photomontage No.1 Figure 10.7.15 Photomontage No.2
Figure 10.7.16 Photomontage No.3Figure 10.7.17 Photomontage No.4Figure 10.7.18 Photomontage No.4 Figure 10.7.19 Photomontage No.5Figure 10.7.20 Photomontage No.5Figure 10.7.21 Photomontage No.6
Figure 10.7.22 Photomontage No.6
Figure 10.7.23 Photomontage No.7
Figure 10.7.24 Photomontage No.7
Figure 10.7.25 Photomontage No.8
Figure 10.7.26 Photomontage No.8
Figure 10.7.27a Photomontage No.9
Figure 10.7.27b Photomontage No.9
Figure 10.7.28 Photomontage No.10
Figure 10.7.29 Photomontage No.10
Figure 10.7.30 Photomontage No.11
Figure 10.7.31 Photomontage No.11
Figure 10.7.32 Photomontage No.12
Figure 10.7.33 Photomontage No.12
Figure 10.7.34 Photomontage No.13
Figure 10.7.35 Photomontage No.13
Figure 10.7.36 Photomontage No.14
Figure 10.7.37 Photomontage No.14
Figure 10.8.1 Road Sections
Figure 10.8.2 Road Sections